In this Excel lesson you will teach yourself how to insert Ethereum Network Difficulty Chart.
First thing you need it to get proper data. Here is the link where you can download csv data.
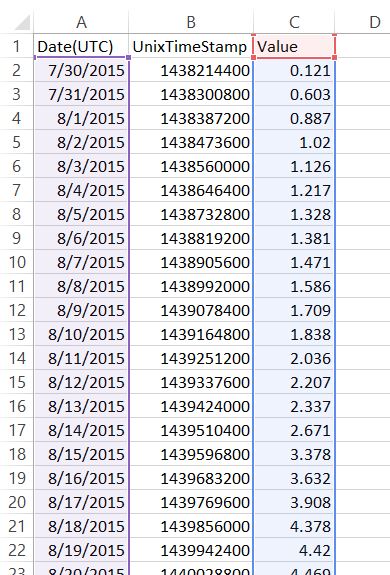
Open downloaded csv file in Excel.
Highlight A and C columns.
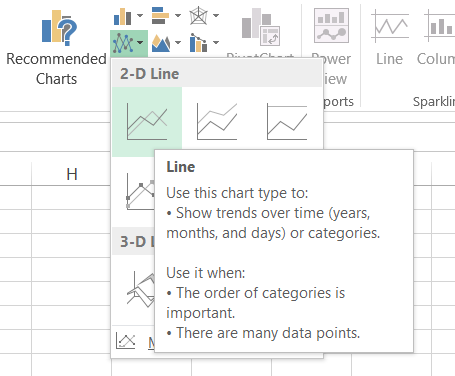
Go to ribbon Insert tab and choose Insert 2D line chart.
Your Ethereum Network Difficulty Grapg is ready.
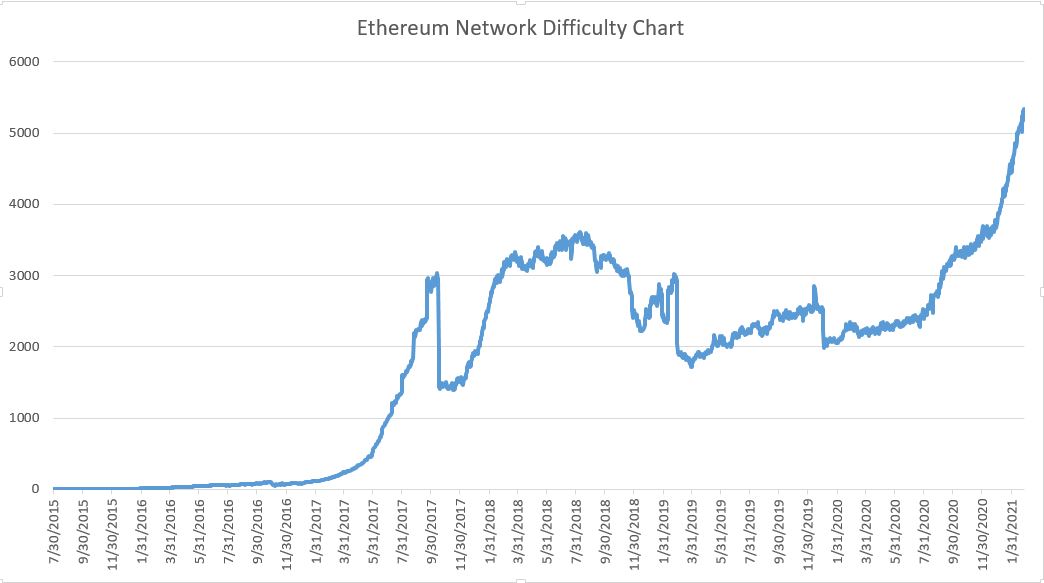
Now you have ready Ethereum Network Difficulty Chart and you can move on with your personal edits. You may need to add trendline.
Here is the link where you can download this Ethereum data spreadsheet.
Further reading:
BitCoin mining calculator
Chart with two trendlines
Correlation chart