A stem-and-leaf plot is a chart we can use to display data by splitting up each value in a dataset into a stem and a leaf.
Here is an example of a stem-and-leaf plot for a given dataset, created by the Statology Stem-and-Leaf Plot Generator:

The stem for each value is simply the first digit of the value while the leaf is the second digit of the value.
Now let’s find out how to create a stem-and-leaf plot in Stata.
Example: Stem-and-Leaf Plot in Stata
Use the following steps to create a stem-and-leaf plot in Stata.
Step 1: Load the data.
We’ll use a built-in Stata dataset called auto for this example. Load this dataset by typing the following into the command box:
use http://www.stata-press.com/data/r13/auto
Step 2: Create a stem-and-leaf plot for the variable mpg.
Type the following into the Command box and click Enter:
stem mpg
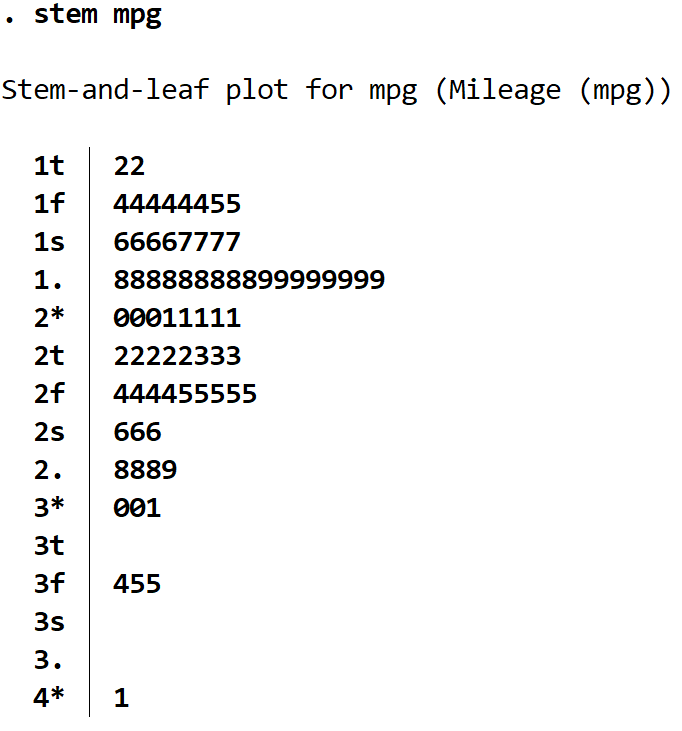
This produces the following stem-and-leaf plot for all of the values for mpg:

By default, Stata splits the stems into multiple lines. You can specify that each stem only uses one line by using the lines() command:
stem mpg, lines(1)

Notice how each stem now has all of its values on one line.
We can also create a stem-and-leaf plot for another variable in the dataset called price, which represents the price of each car in the dataset and takes on values in the thousands.
stem price

We can also use the round() command to round numbers. For example, we can use round(100) to specify that each value of price should be rounded to the hundreds place:
stem price, round(100)

Or we can specify each price to be rounded to the tens place:
stem price, round(10)

Lastly, we can use the command prune to avoid printing any stems that have no leaves:
stem price, round(10) prune

