Chebyshev’s Theorem states that for any number k greater than 1, at least 1 – 1/k2 of the data values in any shaped distribution lie within k standard deviations of the mean.
For example, for any shaped distribution at least 1 – 1/32 = 88.89% of the values in the distribution will lie within 3 standard deviations of the mean.
This tutorial illustrates several examples of how to apply Chebyshev’s Theorem in Excel.
Example 1: Use Chebyshev’s Theorem to find what percentage of values will fall between 30 and 70 for a dataset with a mean of 50 and standard deviation of 10.
First, determine the value for k. We can do this by finding out how many standard deviations away 30 and 70 are from the mean:
(30 – mean) / standard deviation = (30 – 50) / 10 = -20 / 10 = -2
(70 – mean) / standard deviation = (70 – 50) / 10 = 20 / 10 = 2
The values 30 and 70 are 2 standard deviations below and above the mean, respectively. Thus, k = 2.
We can then use the following formula in Excel to find the minimum percentage of values that fall within 2 standard deviations of the mean for this dataset:

The percentage of values that fall within 30 and 70 for this dataset will be at least 75%.
Example 2: Use Chebyshev’s Theorem to find what percentage of values will fall between 20 and 50 for a dataset with a mean of 35 and standard deviation of 5.
First, determine the value for k. We can do this by finding out how many standard deviations away 20 and 50 are from the mean:
(20 – mean) / standard deviation = (20 – 35) / 5 = -15 / 5 = -3
(50 – mean) / standard deviation = (50 – 35) / 5 = 15 / 5 = 3
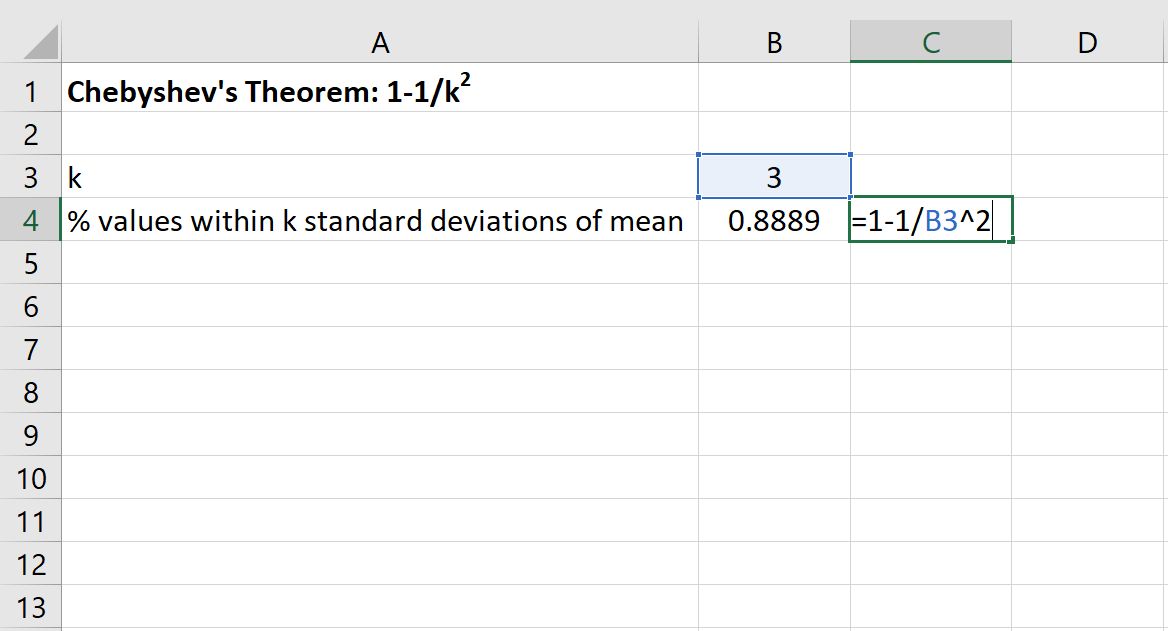
The values 20 and 50 are 3 standard deviations below and above the mean, respectively. Thus, k = 3.
We can then use the following formula in Excel to find the minimum percentage of values that fall within 3 standard deviations of the mean for this dataset:

The percentage of values that fall within 20 and 50 for this dataset will be at least 88.89%.
Example 3: Use Chebyshev’s Theorem to find what percentage of values will fall between 80 and 120 for a dataset with a mean of 100 and standard deviation of 5.
First, determine the value for k. We can do this by finding out how many standard deviations away 80 and 120 are from the mean:
(80 – mean) / standard deviation = (80 – 100) / 5 = -20 / 5 = -4
(120 – mean) / standard deviation = (120 – 100) / 5 = 20 / 5 = 4
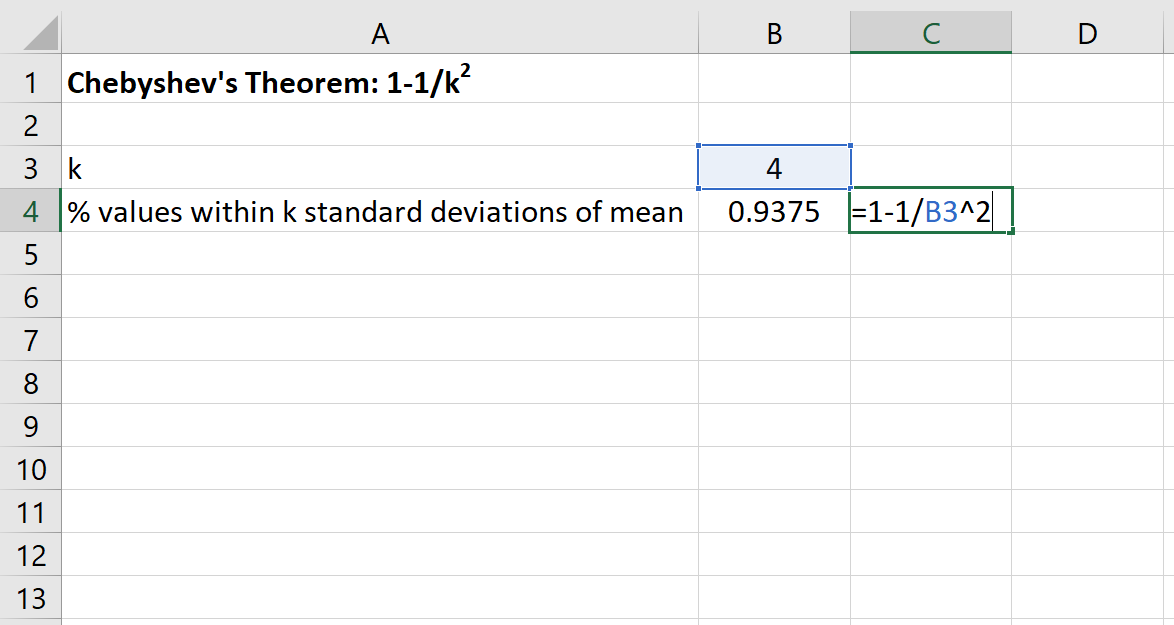
The values 80 and 120 are 4 standard deviations below and above the mean, respectively. Thus, k = 4.
We can then use the following formula in Excel to find the minimum percentage of values that fall within 4 standard deviations of the mean for this dataset:

The percentage of values that fall within 80 and 120 for this dataset will be at least 93.75%.
