98
Often you may want to plot multiple columns from a data frame in R. Fortunately this is easy to do using the visualization library ggplot2.
This tutorial shows how to use ggplot2 to plot multiple columns of a data frame on the same graph and on different graphs.
Example 1: Plot Multiple Columns on the Same Graph
The following code shows how to generate a data frame, then “melt” the data frame into a long format, then use ggplot2 to create a line plot for each column in the data frame:
#load necessary libraries
library(ggplot2)
library(reshape2)

#create data frame
df #melt data frame into long format
df vars = 'index', variable.name = 'series')

#create line plot for each column in data frame
ggplot(df, aes(index, value)) +
  geom_line(aes(colour = series))

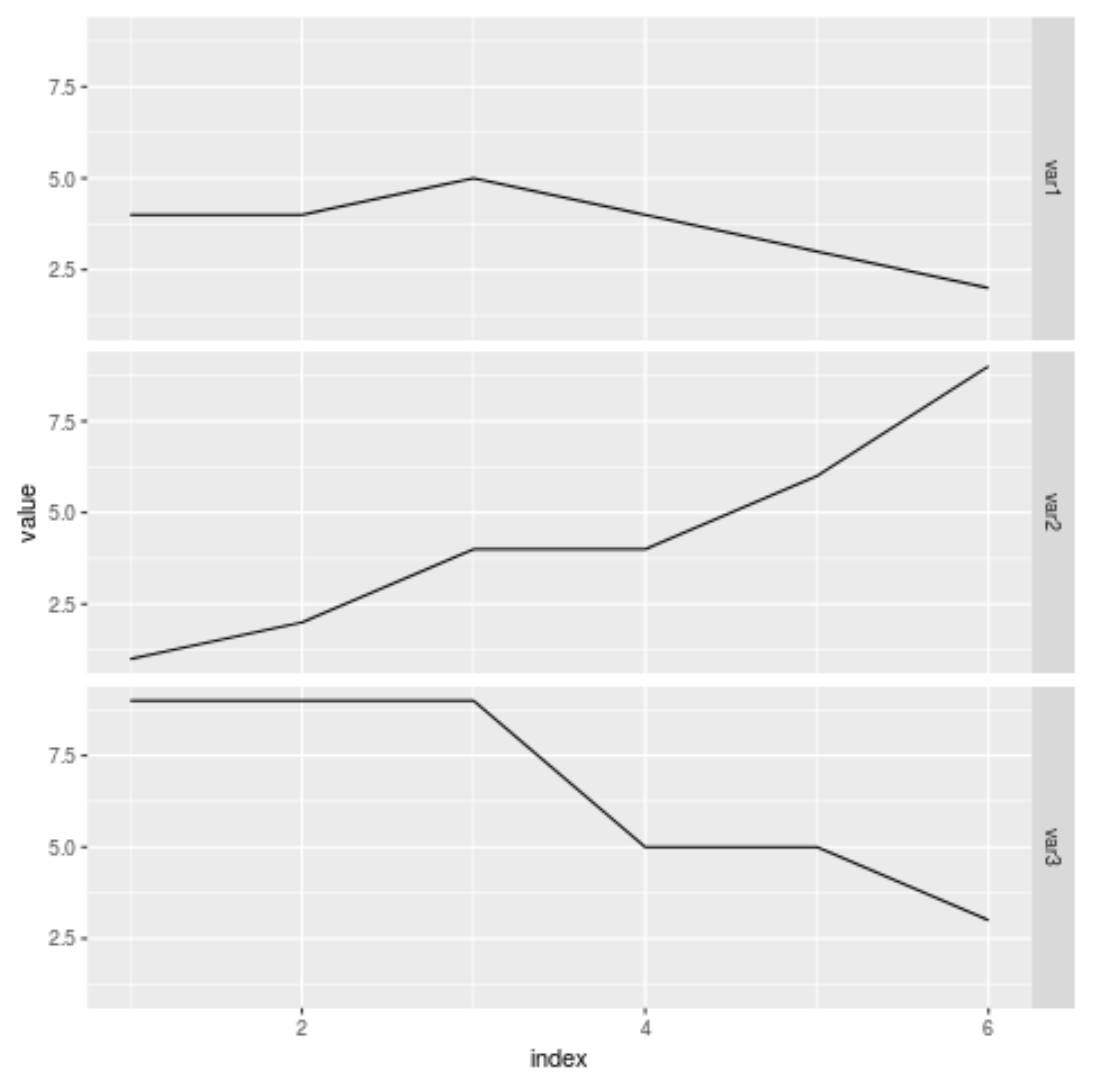
Example 2: Plot Multiple Columns on Different Graphs
The following code shows how to generate a data frame, then “melt” the data frame into a long format, then use ggplot2 to create a line plot for each column in the data frame, splitting up each line into its own plot:
#load necessary libraries
library(ggplot2)
library(reshape2)

#create data frame
df #melt data frame into long format
df vars = 'index', variable.name = 'series')

#create line plot for each column in data frame
ggplot(df, aes(index, value)) +
  geom_line() +
  facet_grid(series ~ .)

Additional Resources
How to Create Side-by-Side Plots in ggplot2
How to Create a Grouped Boxplot in R Using ggplot2
