A Pearson Correlation Coefficient measures the linear association between two variables.
It always takes on a value between -1 and 1 where:
- -1 indicates a perfectly negative linear correlation between two variables
- 0 indicates no linear correlation between two variables
- 1 indicates a perfectly positive linear correlation between two variables
The formula to calculate a Pearson Correlation Coefficient, denoted r, is:

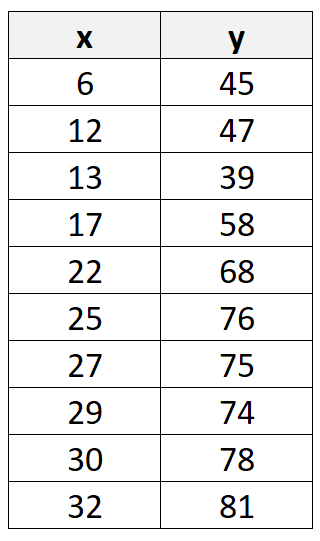
This tutorial provides a step-by-step example of how to calculate a Pearson Correlation Coefficient by hand for the following dataset:
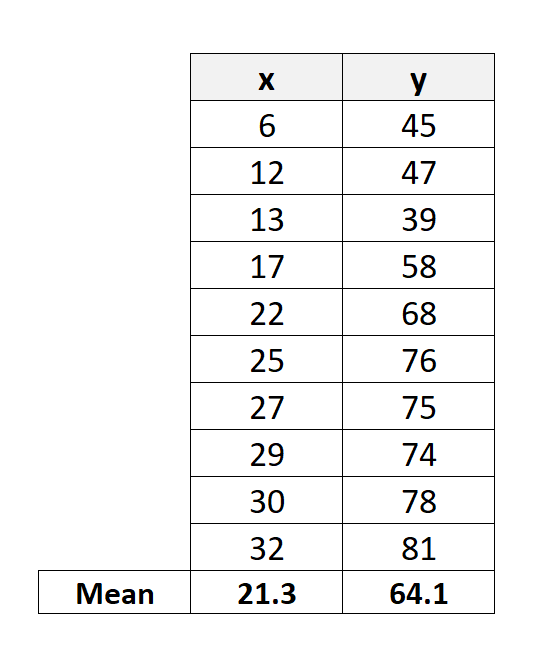
Step 1: Calculate the Mean of X and Y
First, we’ll calculate the mean of both the X and Y values:
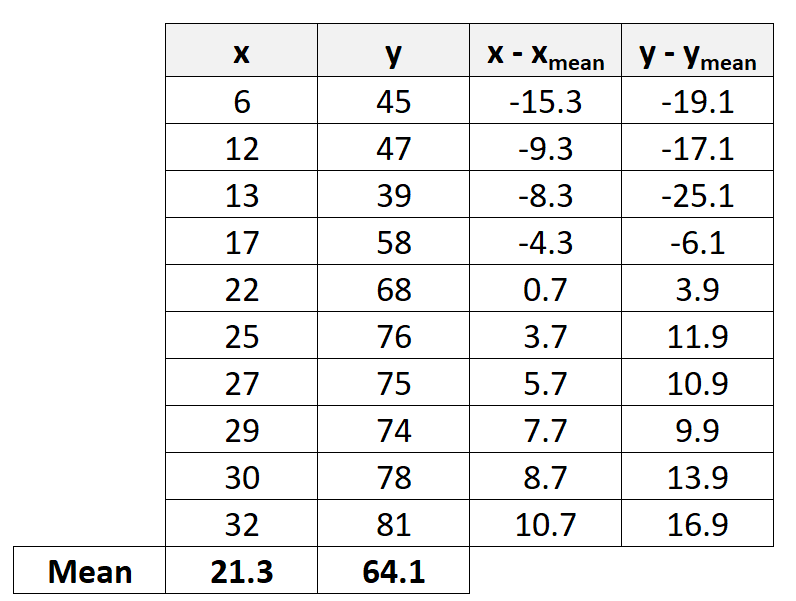
Step 2: Calculate the Difference Between Means
Next, we’ll calculate the difference between each of the individual X and Y values and their respective means:
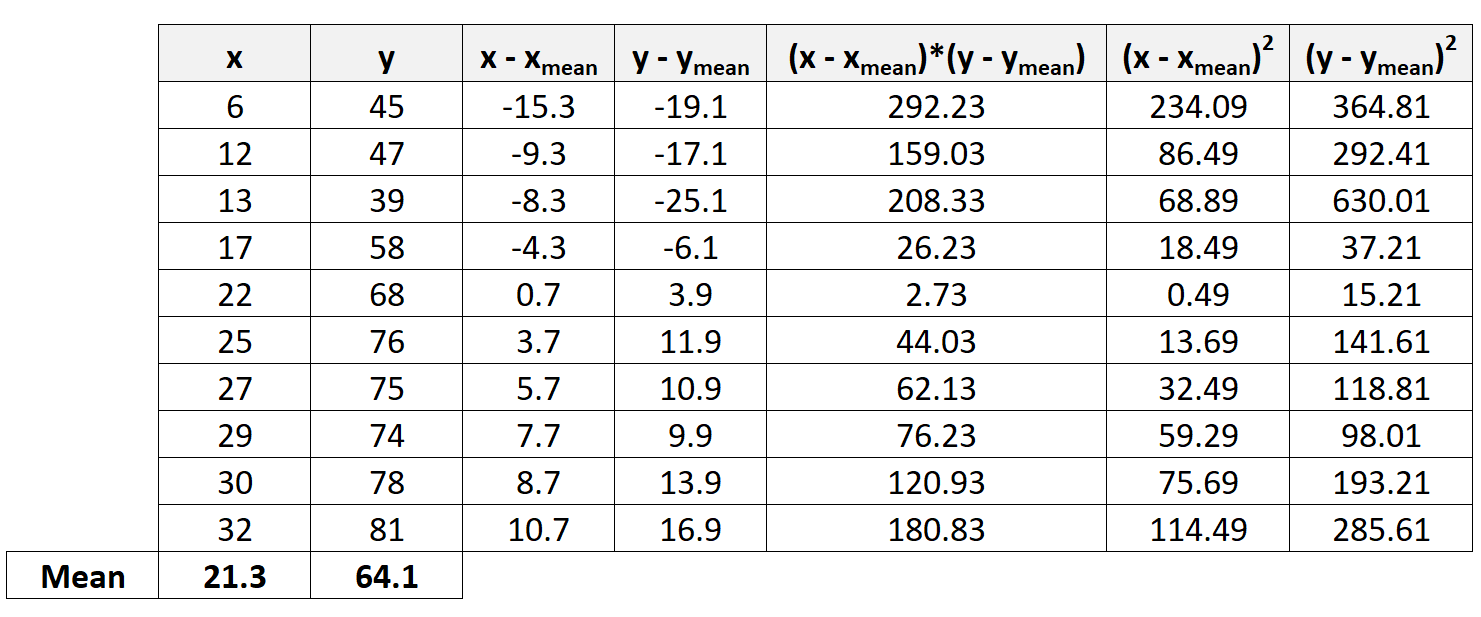
Step 3: Calculate the Remaining Values
Next, we’ll calculate the remaining values needed to complete the Pearson Correlation Coefficient formula:
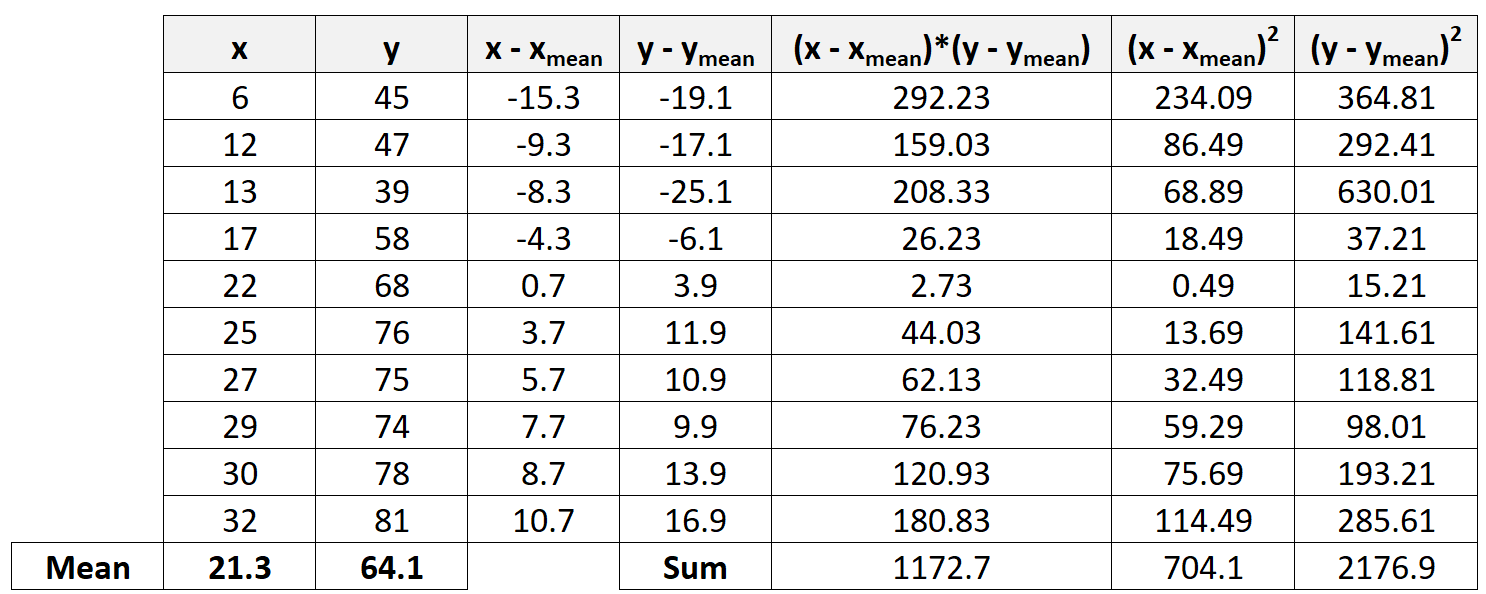
Step 4: Calculate the Sums
Next, we’ll calculate the sums of the the last three columns:
Step 5: Calculate the Pearson Correlation Coefficient
Now we’ll simply plug in the sums from the previous step into the formula for the Pearson Correlation Coefficient:
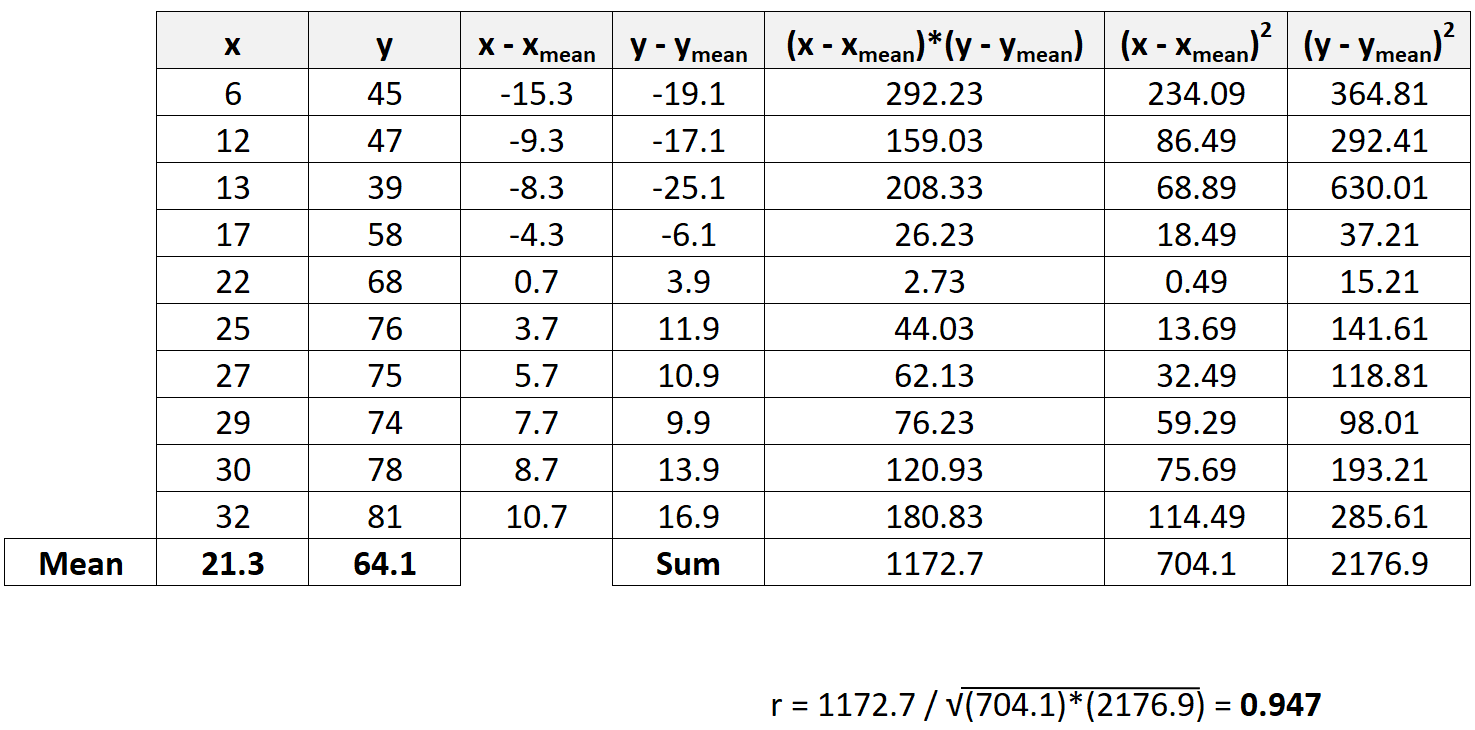
The Pearson Correlation Coefficient turns out to be 0.947.
Since this value is close to 1, this is an indication that X and Y are strongly positively correlated.
In other words, as the value for X increases the value for Y also increases in a highly predictable fashion.
Additional Resources
An Introduction to the Pearson Correlation Coefficient
How to Find a Confidence Interval for a Correlation Coefficient