Often in statistics we’re interested in measuring the correlation between two variables. This helps us understand the following:
- The direction of the relationship between two variables. As one variable increases, does the other variable tend to increase or decrease?
- The strength of the relationship between two variables. How closely do the two variables change in value?
Unfortunately, one problem that can occur when measuring the correlation between two variables is known as restriction of range. This occurs when the range of values measured for one of the variables is restricted for some reason.
For example, suppose we’d like to measure the correlation between hours studied and exam score for students at a particular school.
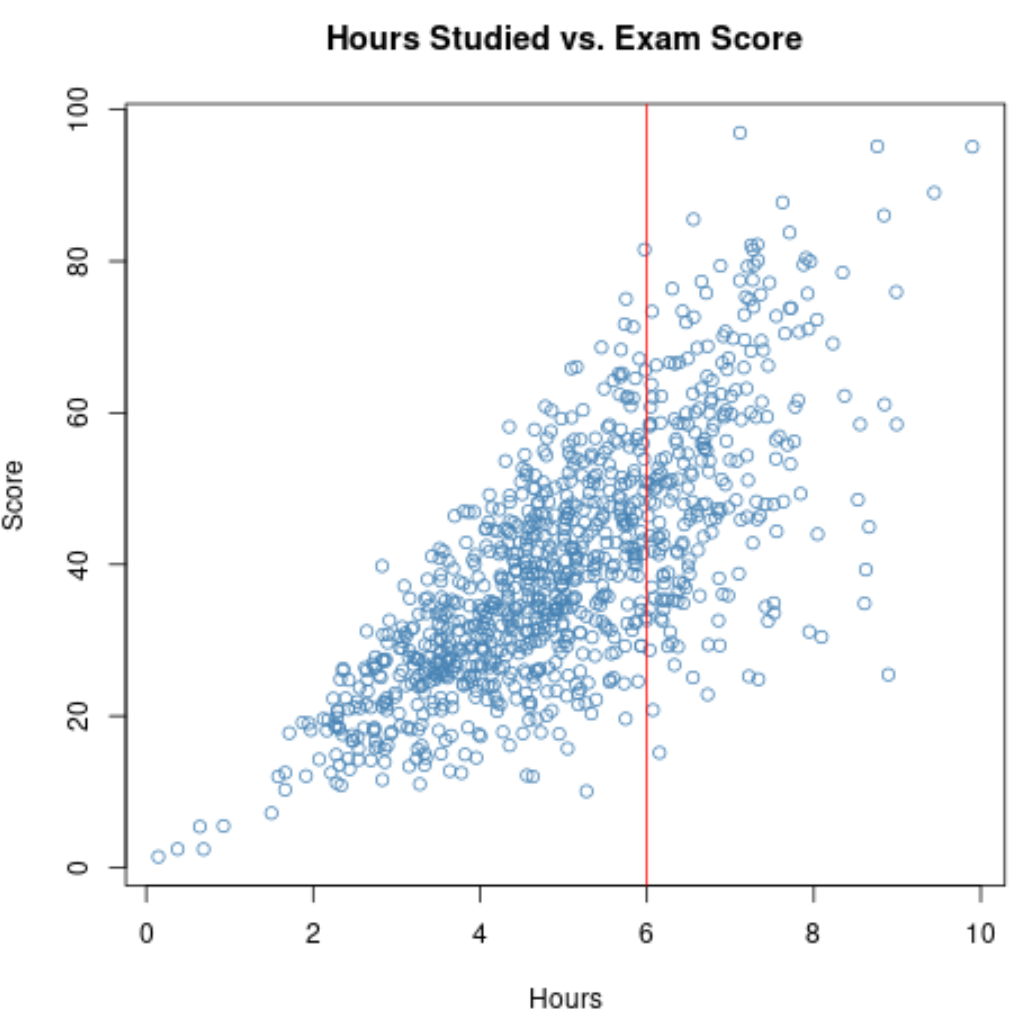
If we collect data on these two variables for all 1,000 students in the school, we may find that the correlation between hours studied and exam score is 0.73.

This correlation is quite high, which indicates a strong positive relationship between the two variables. As students study more, they tend to earn higher exam scores.
However, suppose we only collected data for students in Honors courses. It might turn out that all of these students studied for at least 6 hours.
Thus, if we calculate the correlation between hours studied and exam score for these students, we would be using a restricted range for the variable hours studied.

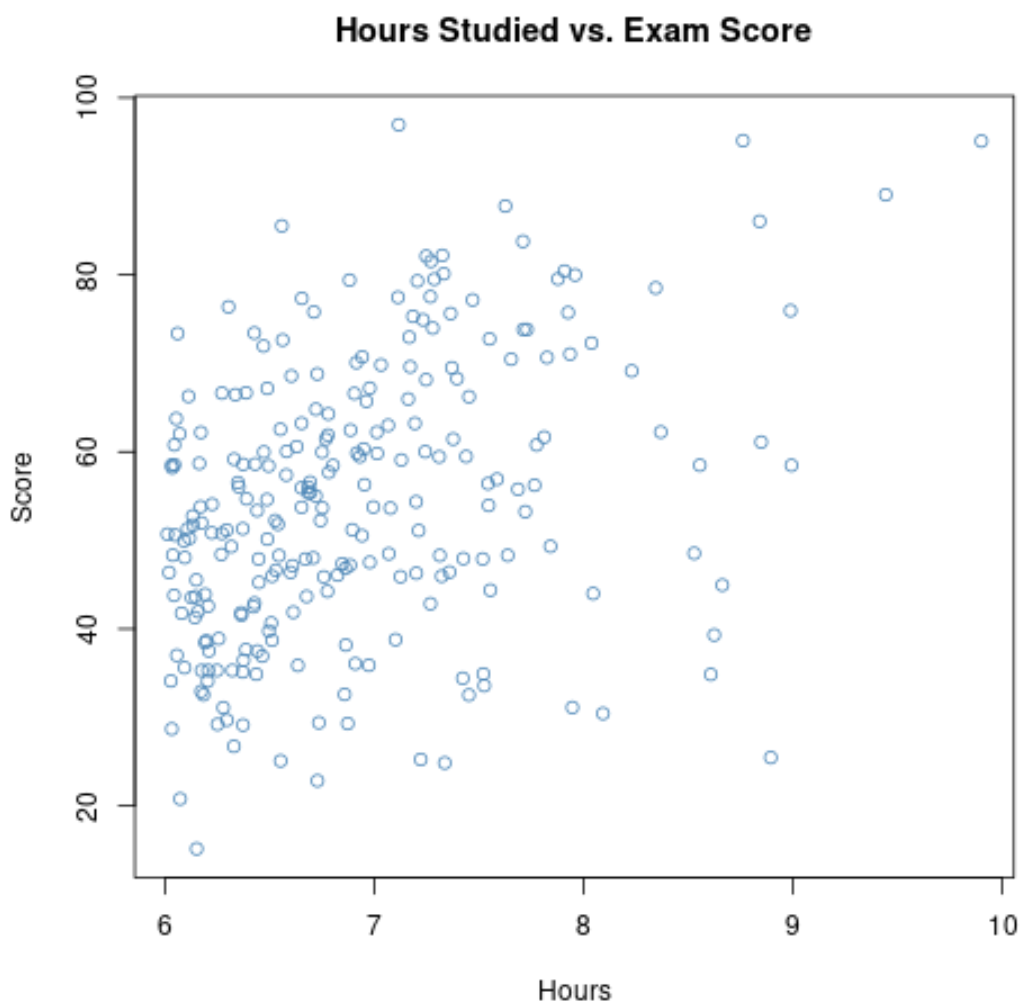
If we zoom in on the scatterplot for the range where Hours is greater than 6, here’s what the plot looks like:

The correlation between the two variables on this plot turns out to be 0.37, which is significantly lower than 0.73.
Thus, if we only collected data on hours studied and exam score for students in Honors courses then we might assume that there is a weak relationship between hours studied and exam score.
However, this result would be misleading because we used a restricted range for one of the variables.
Real-World Examples of Restricted Range
The problem of a restricted range can occur in many different research studies in practice. Here are a couple examples:
1. Studies of high-performance athletes. Researchers may be interested in studying whether or not a certain workout regimen produces more muscle mass than some standard regimen.
If the researchers only collect data for high-performance athletes, it’s likely that these athletes all have a high amount of muscle mass already so there will be a narrow range of values available to calculate the correlation between the workout regimen and the muscle mass produced.
2. Studies of high-performance students. Researchers may be interested in studying whether or not a certain tutoring program has a positive effect on grades. By nature, students who are eager to improve their grades and participate in the tutoring program may already be high-performance students.
Thus, there may not be much room for improvement in grades among these students. When researchers calculate the correlation between the hours spent in the tutoring program and the resulting increase in grades, the true correlation may be understated because the range for improvement in grades has been restricted.
How to Account for Restricted Ranges
One popular way to account for restricted ranges is known as Thorndike’s Case 2, a formula developed by psychometrician Robert L. Thorndike.
This formula provides an estimate of the true correlation between two variables and uses the following calculation:
True correlation = √(1-(SD2y restricted-SD2y unrestricted)) * (1-r2restricted)
where:
- SD2y restricted: The squared standard deviation of the available data on the response variable y.
- SD2y unrestricted: The known squared standard deviation of the response variable for the population.
- r2restricted: The squared correlation on the available restricted data.
This formula has been shown to be effective at producing unbiased estimates of the true correlation between two variables when one of the variables suffers from having a restricted range.
Note that in order to use this formula, you need to have an estimate of the true population standard deviation for the response variable.
