A unimodal distribution is a probability distribution with one clear peak.

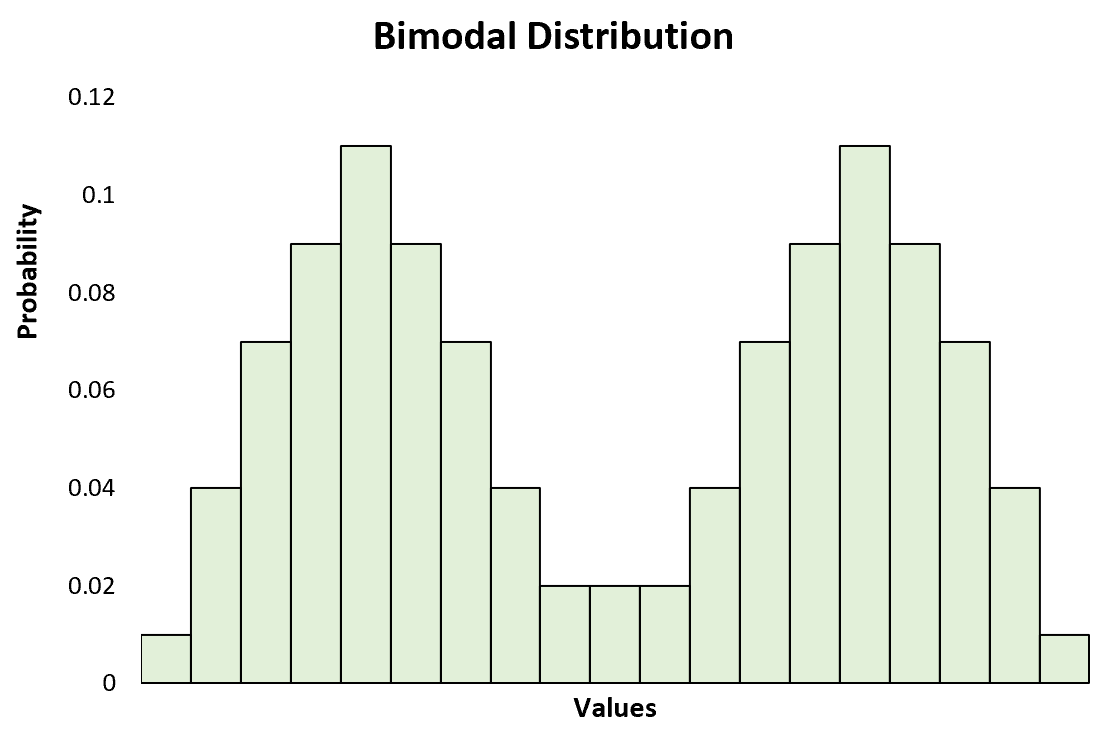
This is in contrast to a bimodal distribution, which has two clear peaks:
This is also in contrast to a multimodal distribution, which has two or more peaks:
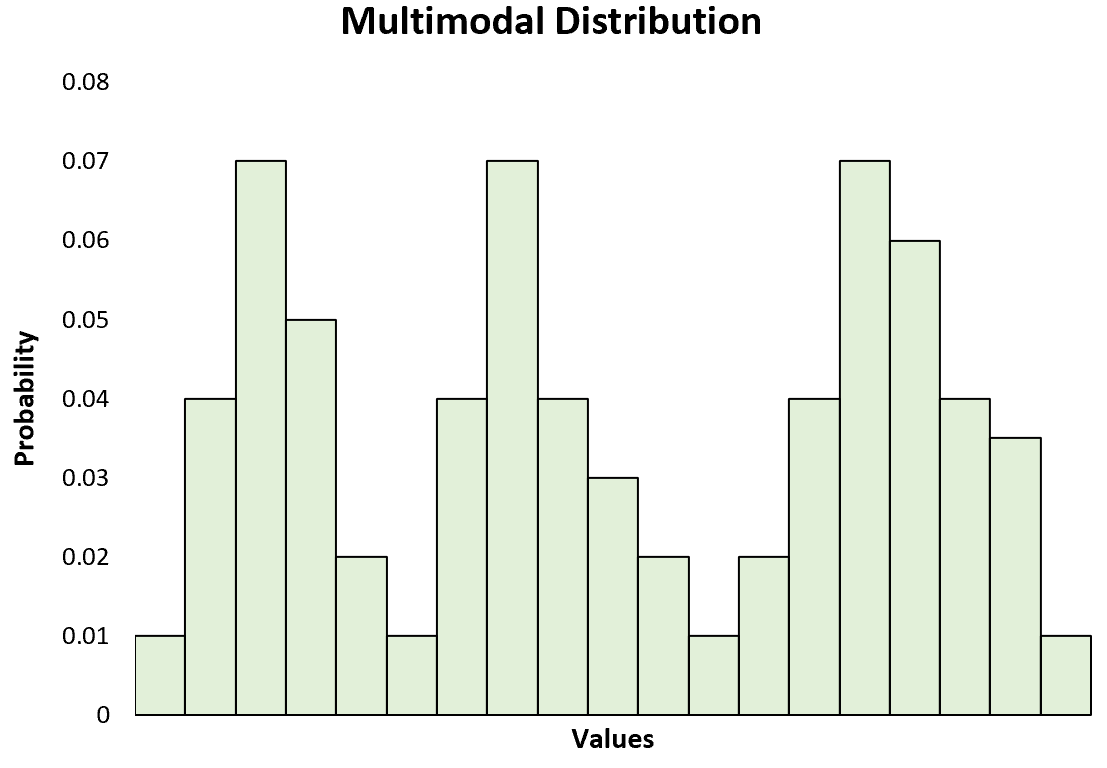
Note: A bimodal distribution is just a specific type of multimodal distribution.
Examples of Unimodal Distributions
Here are a few examples of unimodal distributions in practice.
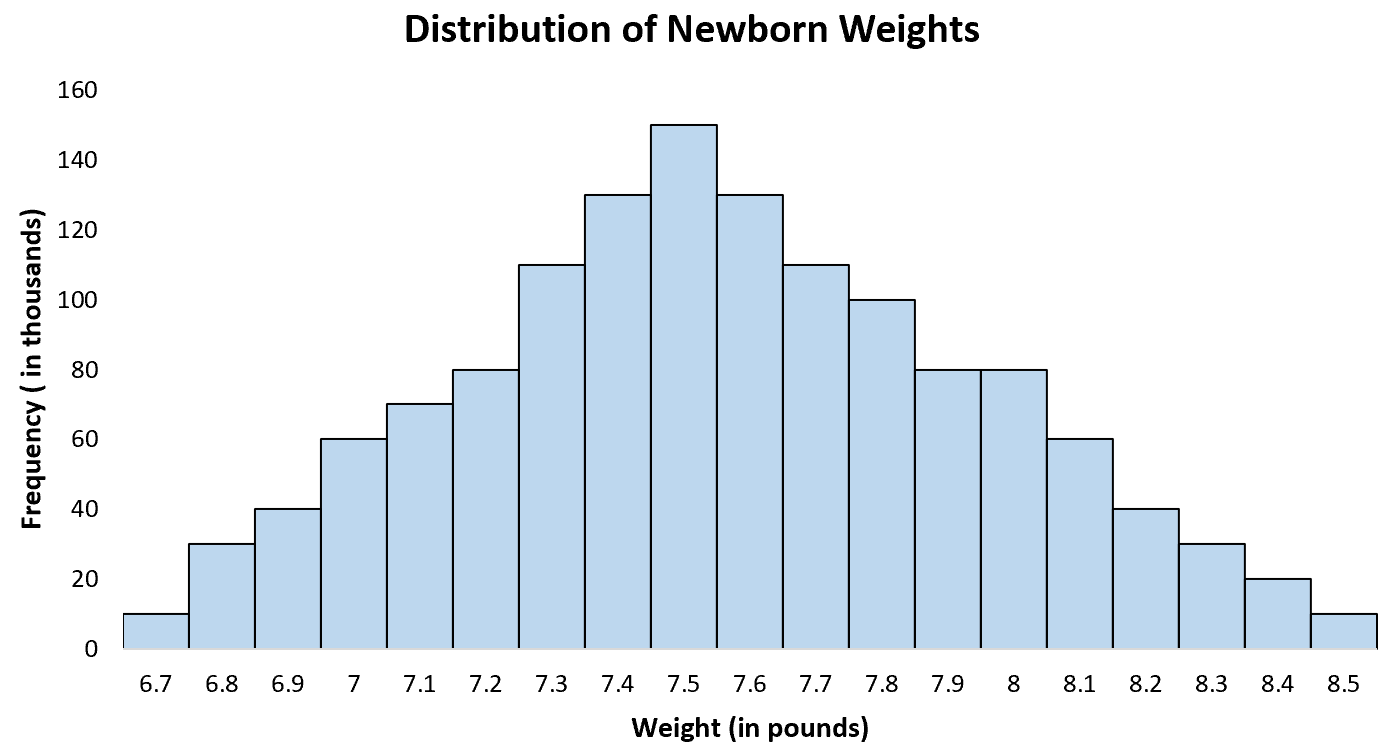
Example 1: Birthweight of Babies
It’s well known that the distribution of the weights of newborn babies follows a unimodal distribution with an average around 7.5 lbs. If we create a histogram of baby weights, we’ll see a “peak” at 7.5 lbs with some babies weighing more and some weighing less.
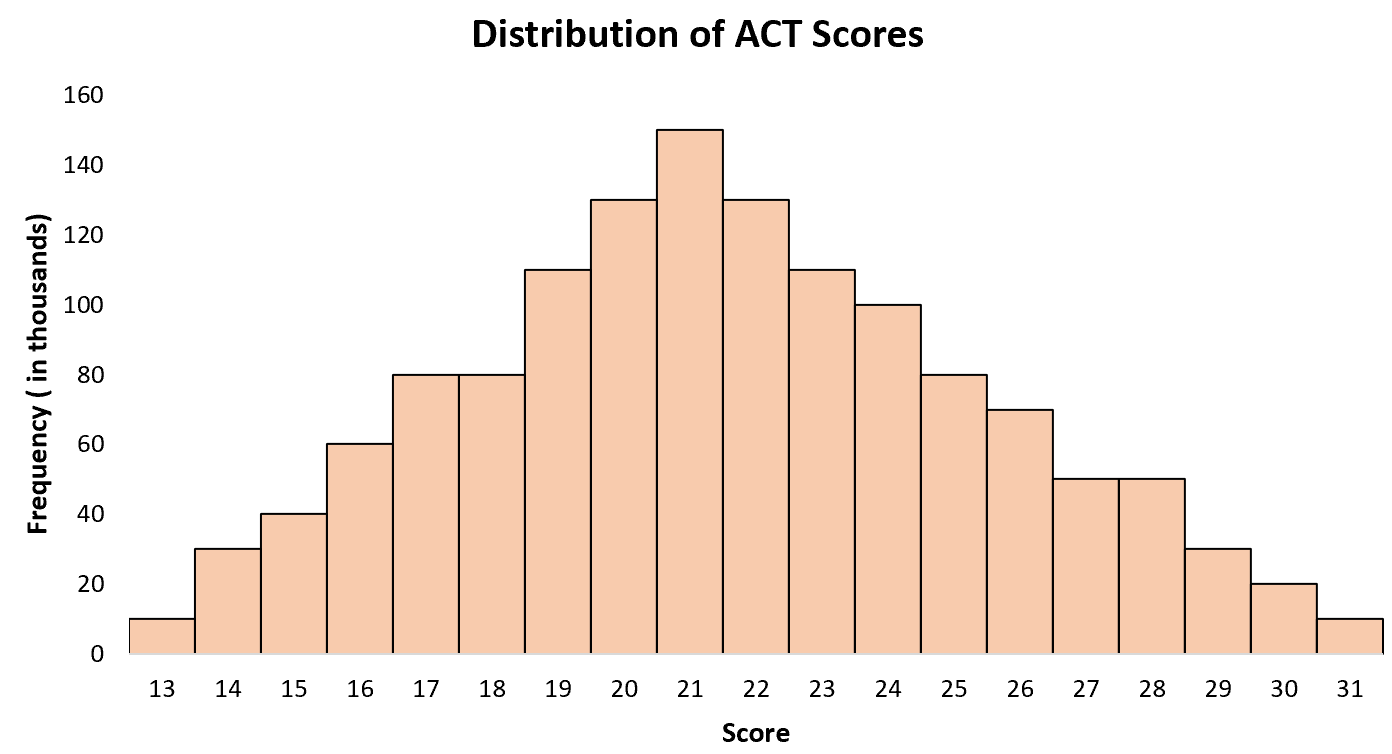
Example 2: ACT Scores
The average ACT score for high school students in the U.S. is about a 21 with some students scoring less and some scoring higher. If we create a histogram of ACT scores for all students in the U.S. we’ll see a single “peak” at 21 with some students scoring higher and some scoring lower.
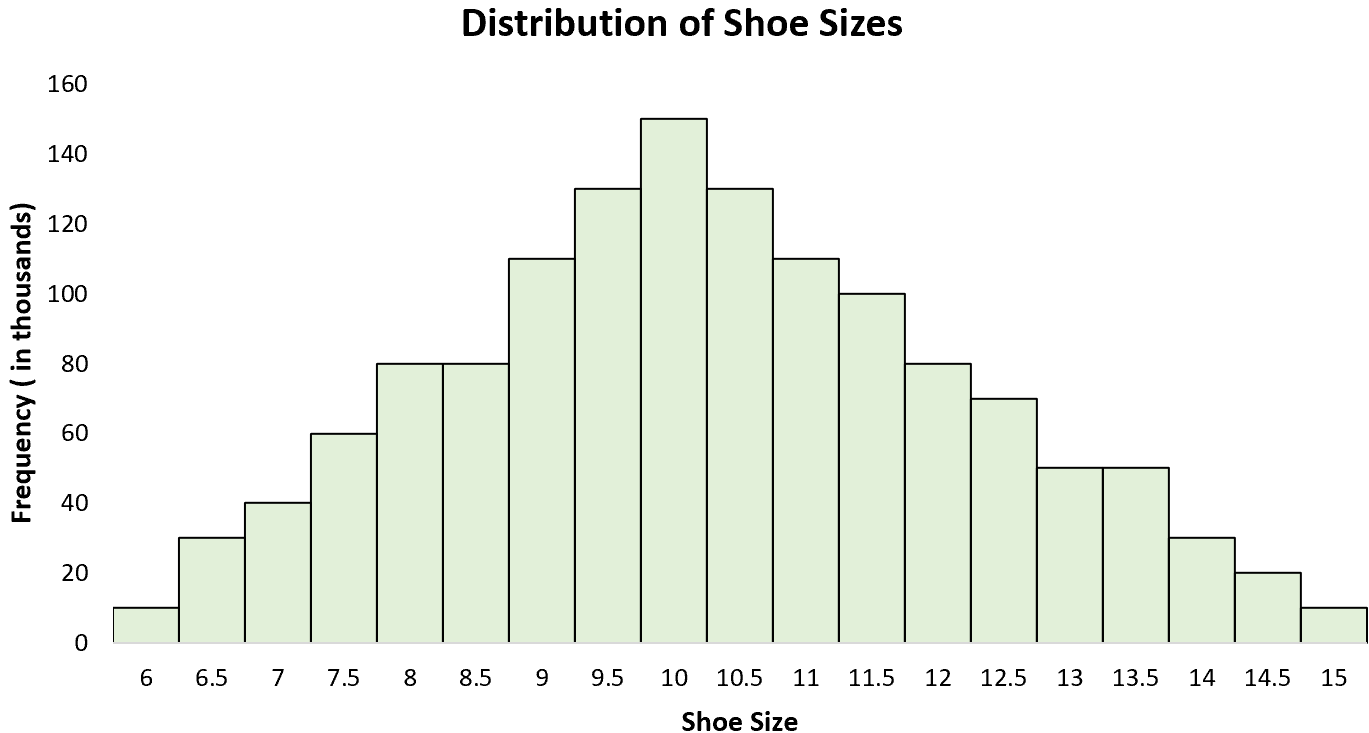
Example 3: Shoe Sizes
The distribution of men’s shoe sizes is a unimodal distribution with a “peak” around 10. If we create a histogram of all shoe sizes for men, we’ll see a single peak at 10 with some men wearing a larger size and some wearing a smaller size.
Unimodal Distributions in Statistics
The following probability distributions in statistics are all unimodal distributions:
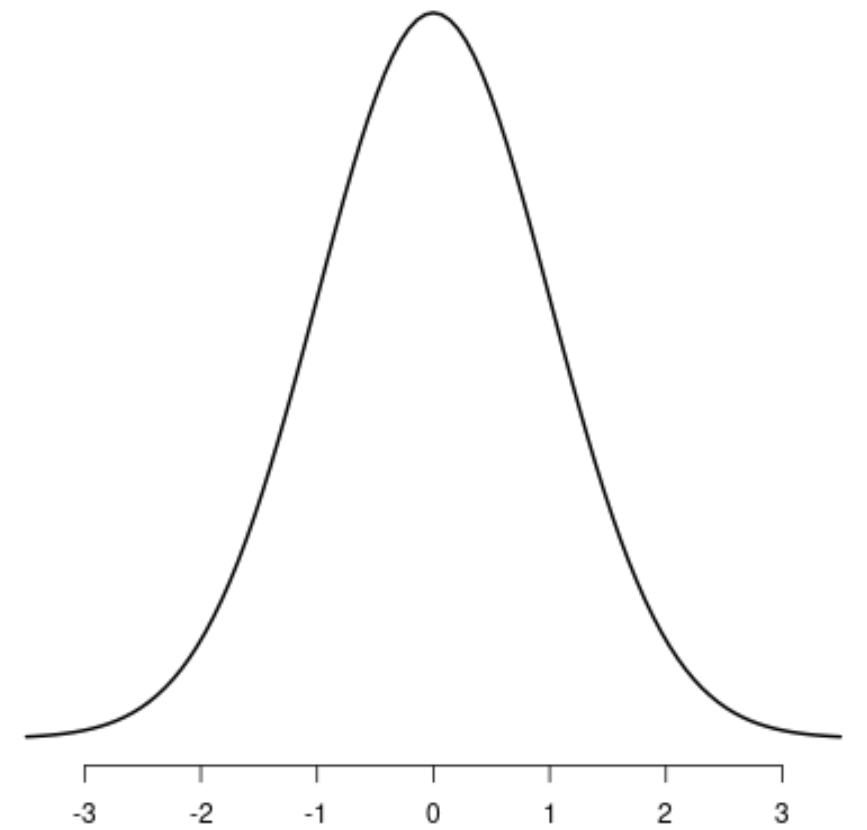
The Normal Distribution
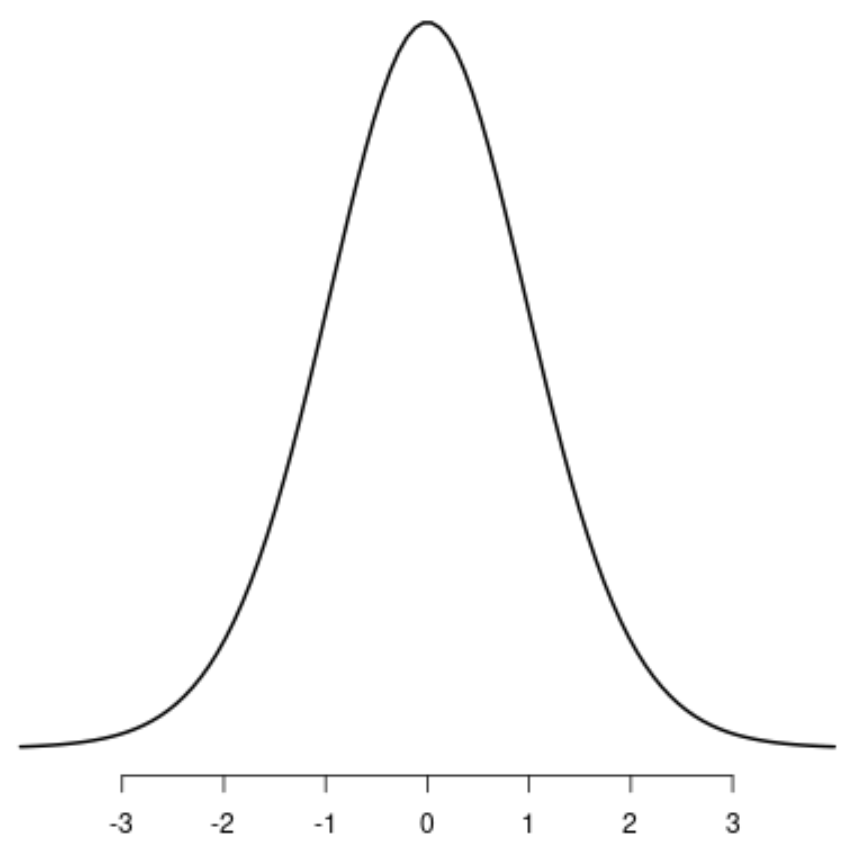
The t-Distribution
The Uniform Distribution

The Cauchy Distribution
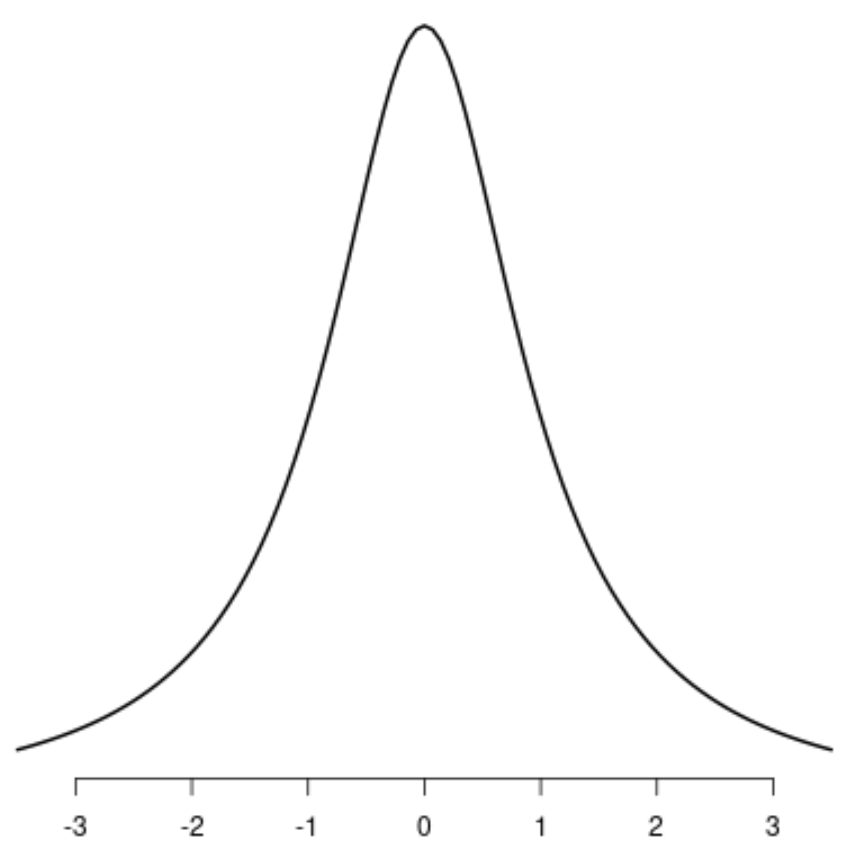
Notice that each of these distributions has a single distinct peak.
How to Analyze Unimodal Distributions
We often describe unimodal distributions using three different measures of central tendency:
- Mean: The average value
- Median: The middle value
- Mode: The value that occurs most often
Depending on how skewed the distribution is, these three metrics can be in different places.
Left Skewed Distribution: Mean
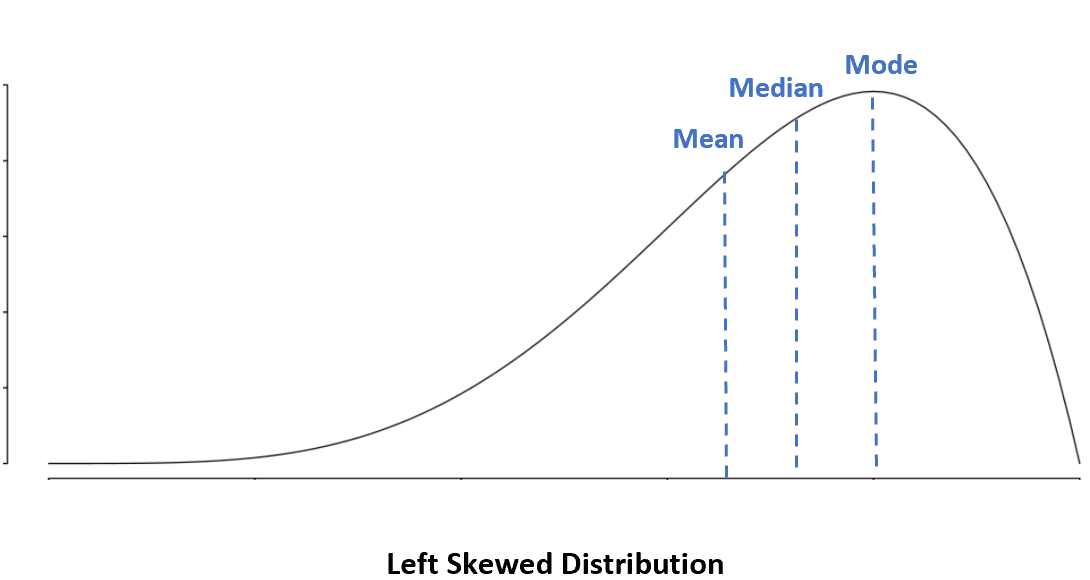
In a left skewed distribution, the mean is less than the median.
Right Skewed Distribution: Mode
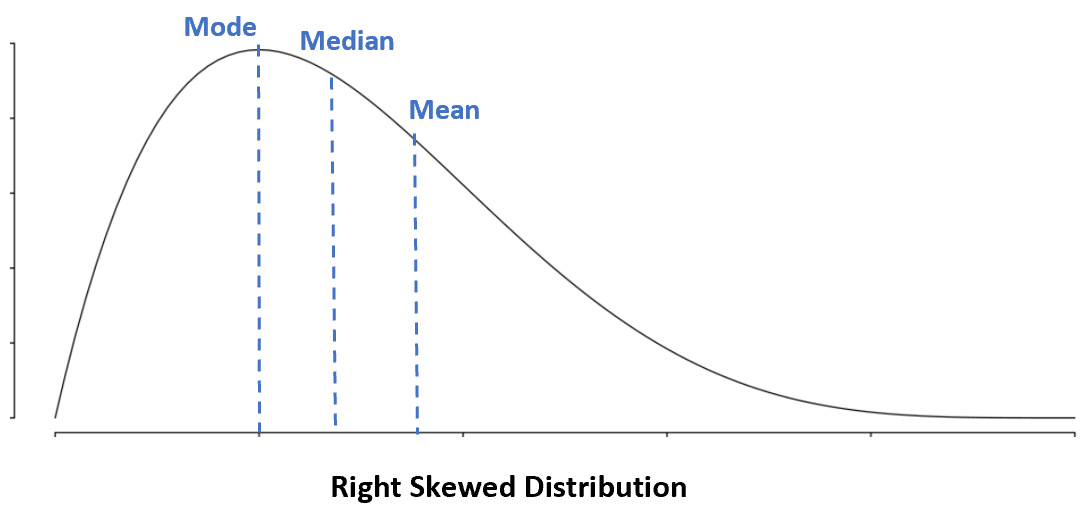
In a right skewed distribution, the mean is greater than the median.
No Skew: Mean = Median = Mode
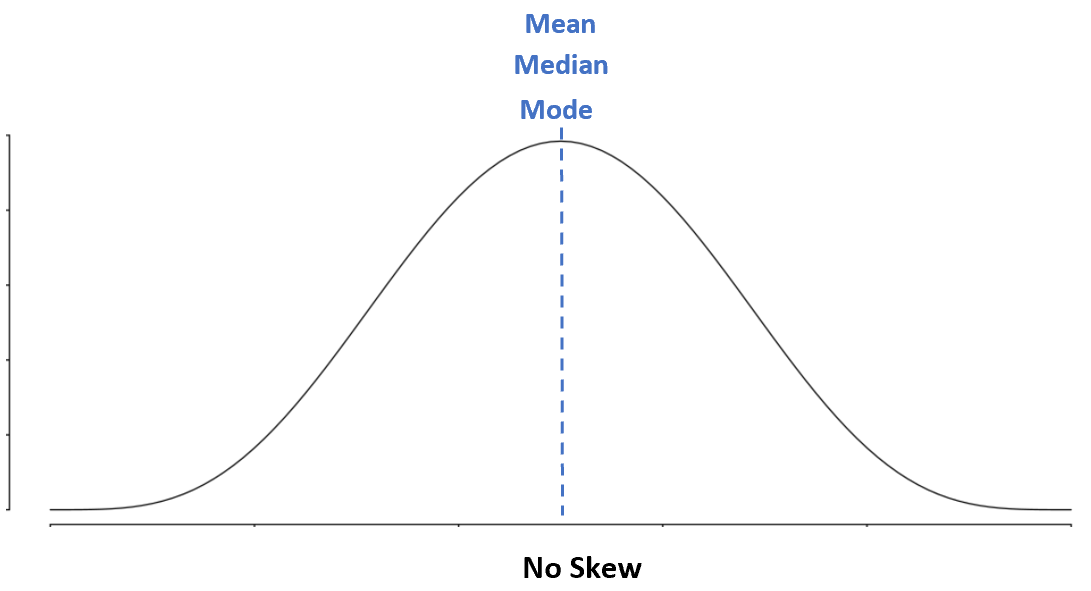
In a symmetrical distribution, the mean, median, and mode are all equal.
Additional Resources
Left Skewed vs. Right Skewed Distributions
Symmetric Distributions: Definition + Examples