A nested ANOVA is a type of ANOVA (“analysis of variance”) in which at least one factor is nested inside another factor.
For example, suppose a researcher wants to know if three different fertilizers produce different levels of plant growth.
To test this, he has three different technicians sprinkle fertilizer A on four plants each, another three technicians sprinkle fertilizer B on four plants each, and another three technicians sprinkle fertilizer C on four plants each.
In this scenario, the response variable is plant growth and the two factors are technician and fertilizer. It turns out that technician is nested within fertilizer:

The following step-by-step example shows how to perform this nested ANOVA in R.
Step 1: Create the Data
First, let’s create a data frame to hold our data in R:
#create data
df frame(growth=c(13, 16, 16, 12, 15, 16, 19, 16, 15, 15, 12, 15,
                          19, 19, 20, 22, 23, 18, 16, 18, 19, 20, 21, 21,
                          21, 23, 24, 22, 25, 20, 20, 22, 24, 22, 25, 26),
                 fertilizer=c(rep(c('A', 'B', 'C'), each=12)),
                 tech=c(rep(1:9, each=4)))

#view first six rows of data
head(df)

  growth fertilizer tech
1     13          A    1
2     16          A    1
3     16          A    1
4     12          A    1
5     15          A    2
6     16          A    2
Step 2: Fit the Nested ANOVA
We can use the following syntax to fit a nested ANOVA in R:
aov(response ~ factor A / factor B)
where:
- response: The response variable
- factor A: The first factor
- factor B: The second factor nested within the first factor
The following code shows how to fit the nested ANOVA for our dataset:
#fit nested ANOVA
nest #view summary of nested ANOVA
summary(nest)

                              Df Sum Sq Mean Sq F value   Pr(>F)
df$fertilizer                  2  372.7  186.33  53.238 4.27e-10 ***
df$fertilizer:factor(df$tech)  6   31.8    5.31   1.516    0.211
Residuals                     27   94.5    3.50
---
Signif. codes:  0 ‘***’ 0.001 ‘**’ 0.01 ‘*’ 0.05 ‘.’ 0.1 ‘ ’ 1
Step 3: Interpret the Output
We can look at the p-value column to determine whether or not each factor has a statistically significant effect on plant growth.
From the table above, we can see that fertilizer has a statistically significant effect on plant growth (p-value
This tells us that if we’d like to increase plant growth, we should focus on the fertilizer being used rather than the individual technician who is sprinkling the fertilizer.
Step 4: Visualize the Results
Lastly, we can use boxplots to visualize the distribution of plant growth by fertilizer and by technician:
#load ggplot2 data visualization package
library(ggplot2)

#create boxplots to visualize plant growth
ggplot(df, aes(x=factor(tech), y=growth, fill=fertilizer)) +
  geom_boxplot()
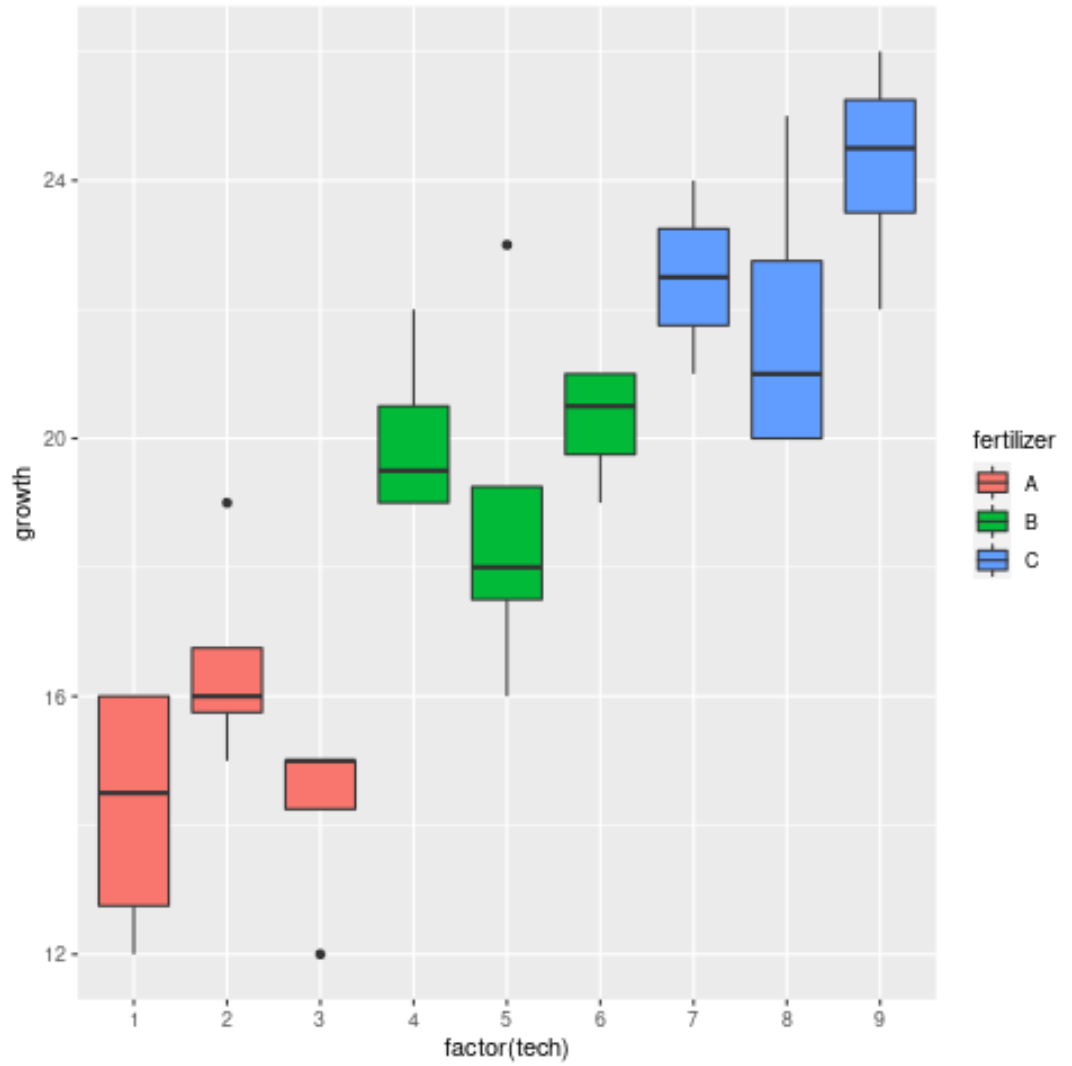
From the chart we can see that there is significant variation in growth between the three different fertilizers, but not as much variation between the technicians within each fertilizer group.
This seems to match up with the results of the nested ANOVA and confirms that fertilizer has a significant effect on plant growth but individual technicians do not.
Additional Resources
How to Perform a One-Way ANOVA in R
How to Perform a Two-Way ANOVA in R
How to Perform a Repeated Measures ANOVA in R