42
You can use the following syntax to plot multiple series from a single pandas DataFrame:
plt.plot(df['series1'])
plt.plot(df['series2'])
plt.plot(df['series3'])
The following step-by-step example shows how to use this syntax in practice.
Step 1: Create the Data
First, let’s create a pandas DataFrame that contains the total sales made by three companies during an 8-week period:
import pandas as pd

#create data
df = pd.DataFrame({'A': [9, 12, 15, 14, 19, 23, 25, 29],
                   'B': [5, 7, 7, 9, 12, 9, 9, 14],
                   'C': [5, 4, 7, 13, 15, 15, 18, 31]})
#view data
print(df)

    A   B   C
0   9   5   5
1  12   7   4
2  15   7   7
3  14   9  13
4  19  12  15
5  23   9  15
6  25   9  18
7  29  14  31
Step 2: Plot Multiple Series
Next, let’s plot the sales of each company on the same chart:
import matplotlib.pyplot as plt

#plot each series
plt.plot(df['A'])
plt.plot(df['B'])
plt.plot(df['C'])

#display plot
plt.show()

Step 3: Add a Legend and Labels
Next, let’s add a legend and some axes labels to make the plot easier to read:
#plot individual lines with custom colors and labels
plt.plot(df['A'], label='A', color='green')
plt.plot(df['B'], label='B', color='steelblue')
plt.plot(df['C'], label='C', color='purple')

#add legend
plt.legend(title='Group')

#add axes labels and a title
plt.ylabel('Sales', fontsize=14)
plt.xlabel('Time', fontsize=14)
plt.title('Sales by Group', fontsize=16)

#display plot
plt.show() 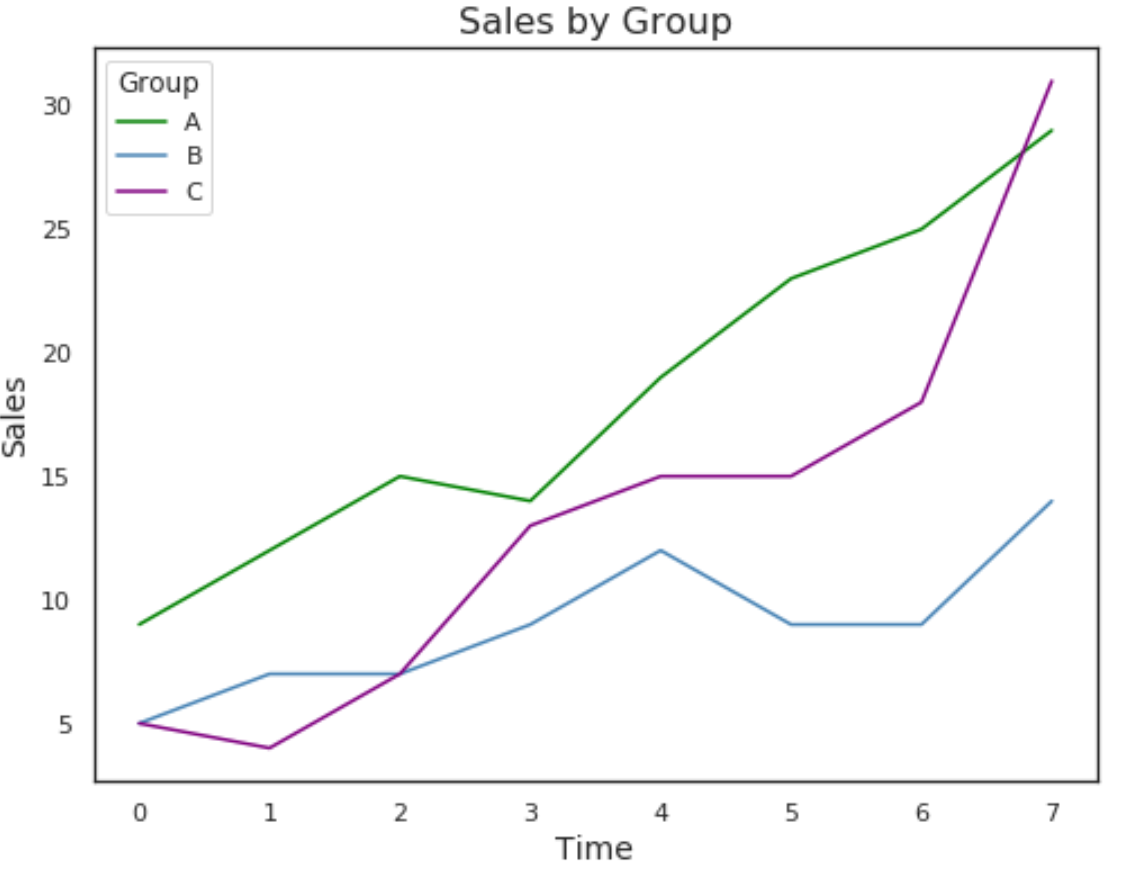
You can find more pandas tutorials on this page.