You can use the following basic syntax to change the font size in Seaborn plots:
import seaborn as sns

sns.set(font_scale=2)
Note that the default value for font_scale is 1. By increasing this value, you can increase the font size of all elements in the plot.
The following examples show how to use this syntax in practice.
Example 1: Change Font Size of All Elements in Seaborn Plot
The following code shows how to create a simple line chart in Seaborn with the default font size:
import pandas as pd
import matplotlib.pyplot as plt
import seaborn as sns

#create DataFrame
df = pd.DataFrame({'date': ['1/1/2021', '1/30/2021', '1/1/2021', '1/30/2021'],
                   'sales': [4, 11, 6, 18],
                   'company': ['A', 'A', 'B', 'B']})

#plot multiple lines
sns.lineplot(x='date', y='sales', hue='company', data=df).set(title='Sales Data')

And the following code shows how to use the sns.set() function to increase the font size of all elements in the plot:
import pandas as pd
import matplotlib.pyplot as plt
import seaborn as sns

#increase font size of all elements
sns.set(font_scale=2)

#create DataFrame
df = pd.DataFrame({'date': ['1/1/2021', '1/30/2021', '1/1/2021', '1/30/2021'],
                   'sales': [4, 11, 6, 18],
                   'company': ['A', 'A', 'B', 'B']})

#plot multiple lines
sns.lineplot(x='date', y='sales', hue='company', data=df).set(title='Sales Data')
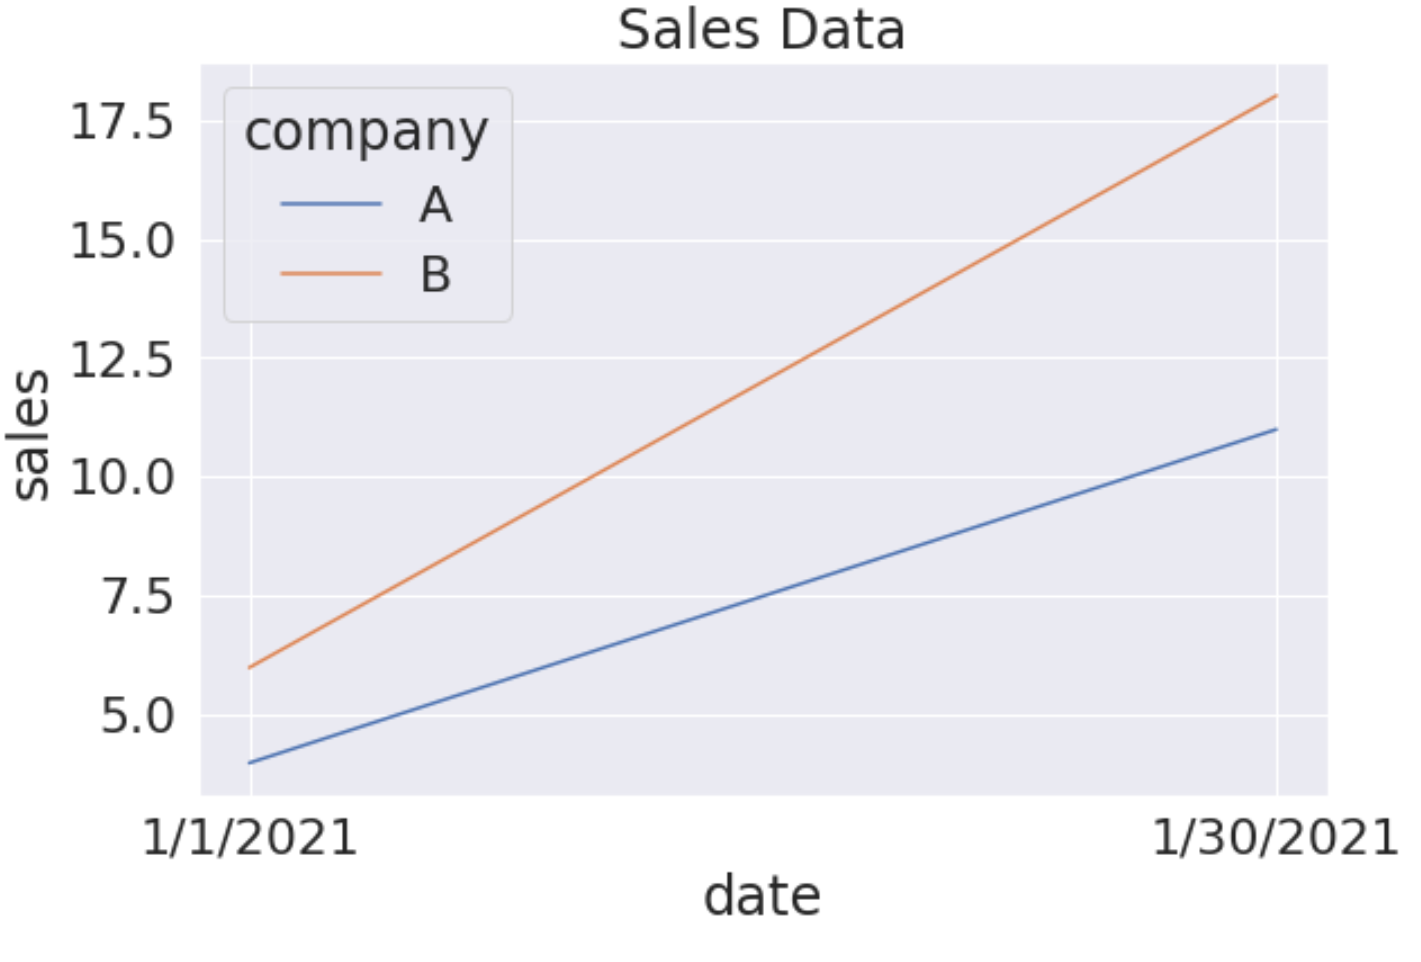
Notice that the font size for each element in the plot has increased dramatically.
Example 2: Change Font Size of Specific Elements in Seaborn Plot
The following code shows how to change the font size of specific elements in a Seaborn plot:
import pandas as pd
import matplotlib.pyplot as plt
import seaborn as sns

#create DataFrame
df = pd.DataFrame({'date': ['1/1/2021', '1/30/2021', '1/1/2021', '1/30/2021'],
                   'sales': [4, 11, 6, 18],
                   'company': ['A', 'A', 'B', 'B']})

#plot multiple lines
sns.lineplot(x='date', y='sales', hue='company', data=df)

#modify individual font size of elements
plt.legend(title='Company', fontsize=20)
plt.xlabel('Date', fontsize=16);
plt.ylabel('Sales', fontsize=16);
plt.title('Sales Data', fontsize=20)
plt.tick_params(axis='both', which='major', labelsize=14)
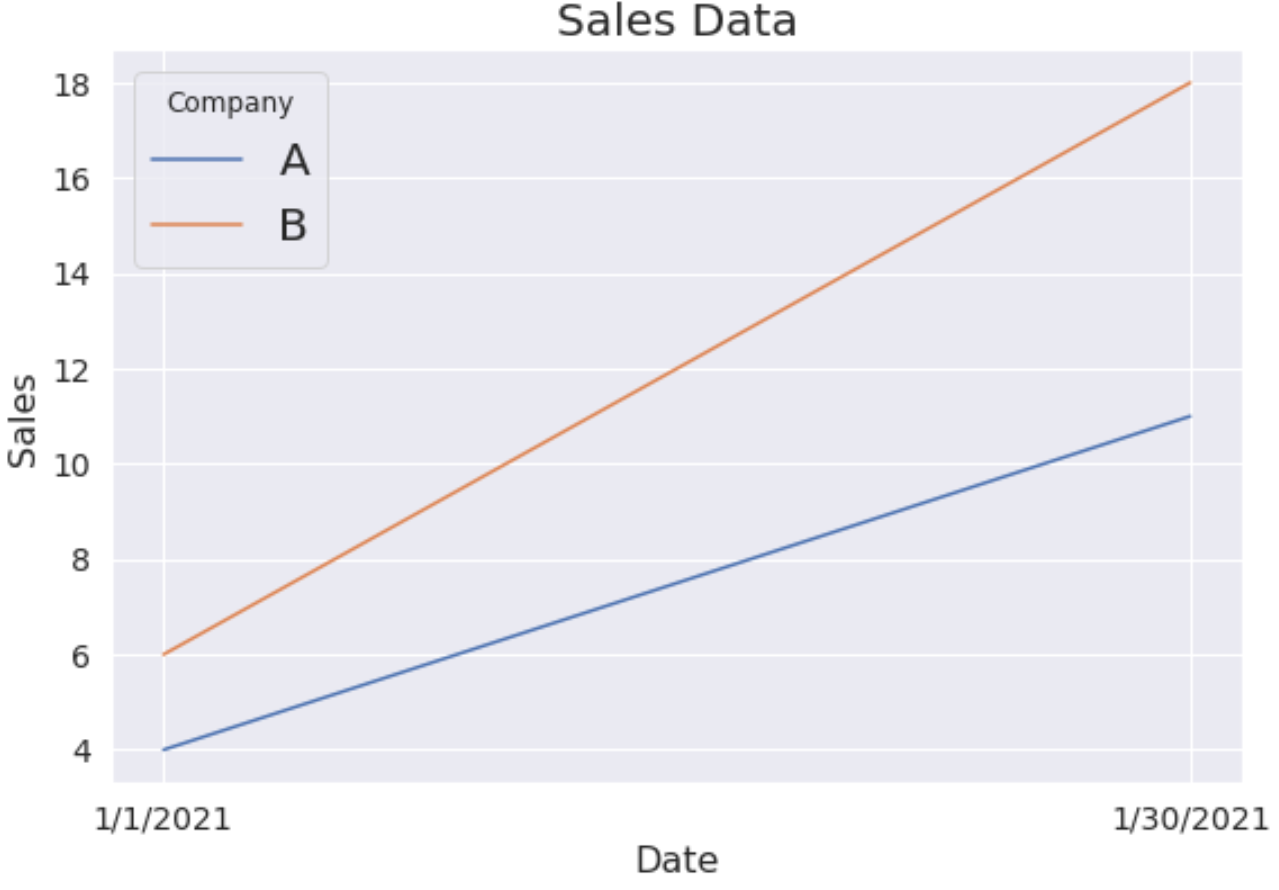
Notice that each element in the plot has a unique font size based on the value specified in the fontsize argument.
Additional Resources
The following tutorials explain how to perform other common operations in Seaborn:
How to Create Multiple Seaborn Plots in One Figure
How to Change the Position of a Legend in Seaborn
How to Add a Title to Seaborn Plots