You can use the following formula to count the number of unique values by group in Excel:
=SUMPRODUCT(($A$2:$A$13=A2)/COUNTIFS($B$2:$B$13, $B$2:$B$13, $A$2:$A$13, $A$2:$A$13))
This formula assumes that the group names are in the range A2:A13 and the values are in the range B2:B13.
The following example shows how to use this formula in practice.
Example: Count Unique Values by Group in Excel
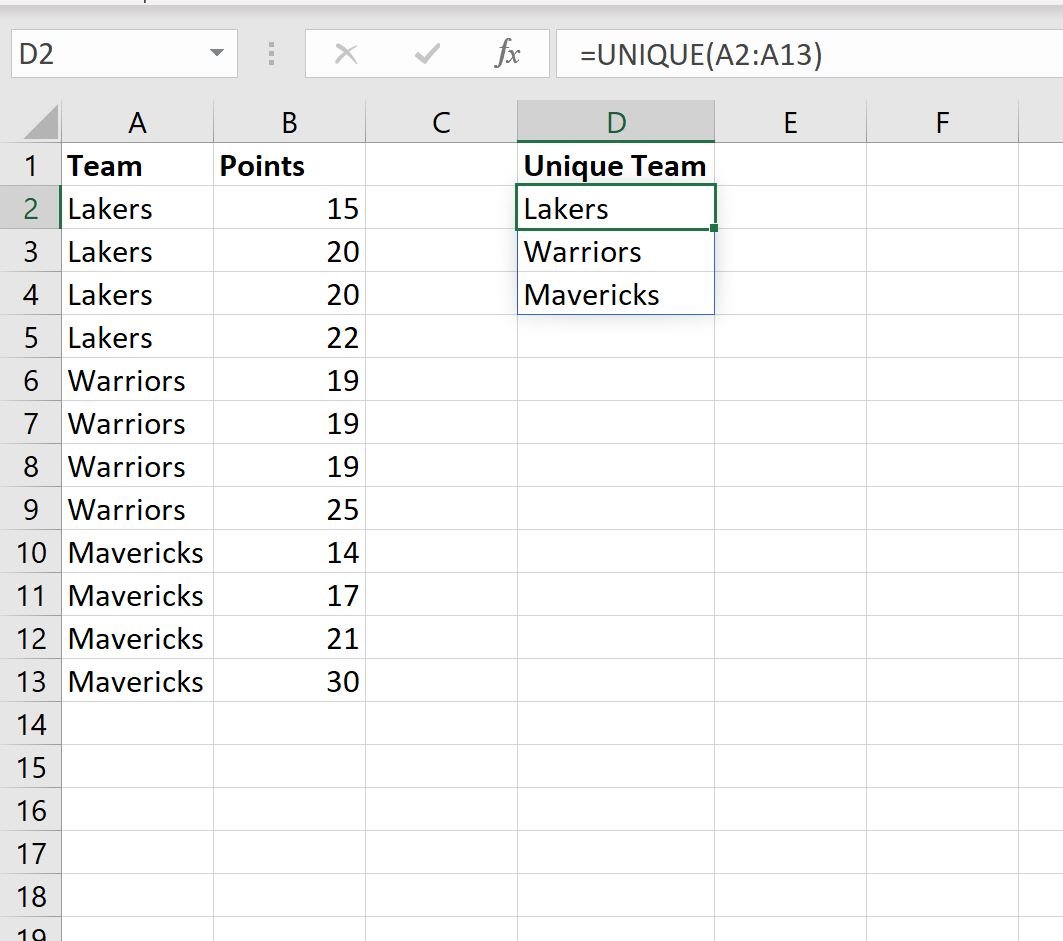
Suppose we have the following dataset that shows the points scored by basketball players on various teams:

Now suppose we’d like to count the number of unique points values, grouped by team.
To do so, we can use the =UNIQUE() function to first create a list of the unique teams. We’ll type the following formula into cell D2:
=UNIQUE(A2:A13)
Once we press enter, a list of unique team names will be displayed:

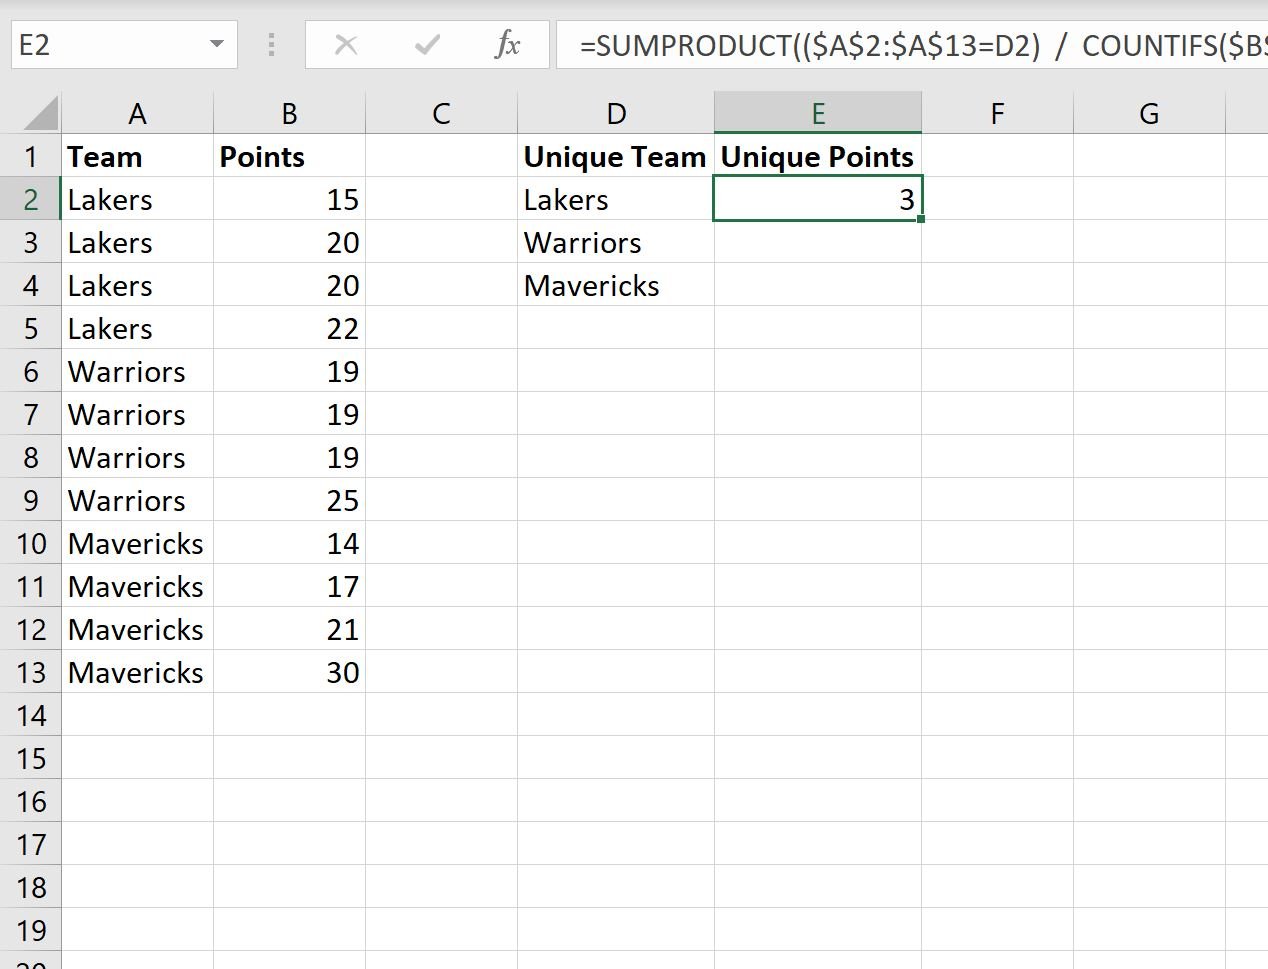
Now we can type the following formula into cell E2 to count the number of unique points values for the Lakers:
=SUMPRODUCT(($A$2:$A$13=D2)/COUNTIFS($B$2:$B$13, $B$2:$B$13, $A$2:$A$13, $A$2:$A$13))

We’ll then drag this formula down to the remaining cells in column E:

That’s it!
Column D displays each of the unique teams and column E displays the count of unique points values for each team.
Additional Resources
The following tutorials explain how to perform other common tasks in Excel:
Excel: How to Count If Cells Contain Text
Excel: How to Use COUNTIF with Multiple Ranges
Excel: How to Count Unique Values Based on Multiple Criteria
