You can use proc univariate in SAS with the normal statement to perform several normality tests on a variable in a dataset.
This procedure uses the following basic syntax:
proc univariate data=my_data normal;
    var my_variable;
run;
The following example shows how to use this procedure in practice.
Example: Proc Univariate for Normality Tests in SAS
Suppose we have the following dataset in SAS that contains information about various basketball players:
/*create dataset*/
data my_data;
    input team $ points rebounds;
    datalines;
A 12 8
A 12 8
A 12 8
A 23 9
A 20 12
A 14 7
A 14 7
B 20 2
B 20 5
B 29 4
B 14 7
B 20 2
B 20 2
B 20 5
;
run;

/*view dataset*/
proc print data=my_data;

We can use proc univariate with the normal statement to perform various normality tests on the points variable:
proc univariate data=my_data normal;
    var points;
run;
Several tables will be shown in the output but the one titled Tests for Normality contains the results of the normality tests:
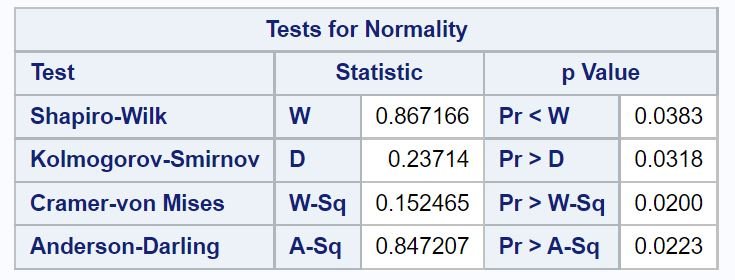
By default, SAS performs four normality tests and displays each of their test statistics and corresponding p-values:
- Shapiro-Wilk Test: W = .867, p = .0383
- Kolmogorov-Smirnov Test: D = .237, p = .0318
- Cramer-von Mises Test: W-Sq = .152, p = .0200
- Anderson-Darling Test: A-Sq = .847, p = .0223
Each normality test uses the following null and alternative hypotheses:
- H0: The data are normally distributed.
- HA: The data are not normally distributed.
Since the p-value for each normality test is less than .05, we would reject the null hypothesis for each normality test.
This means there is sufficient evidence to conclude that the points variable is not normally distributed.
Note that you can also create a histogram with a normal curve overlaid on it to visualize the distribution of values for the points variable:
proc univariate data=my_data;
    histogram points / normal;
run; 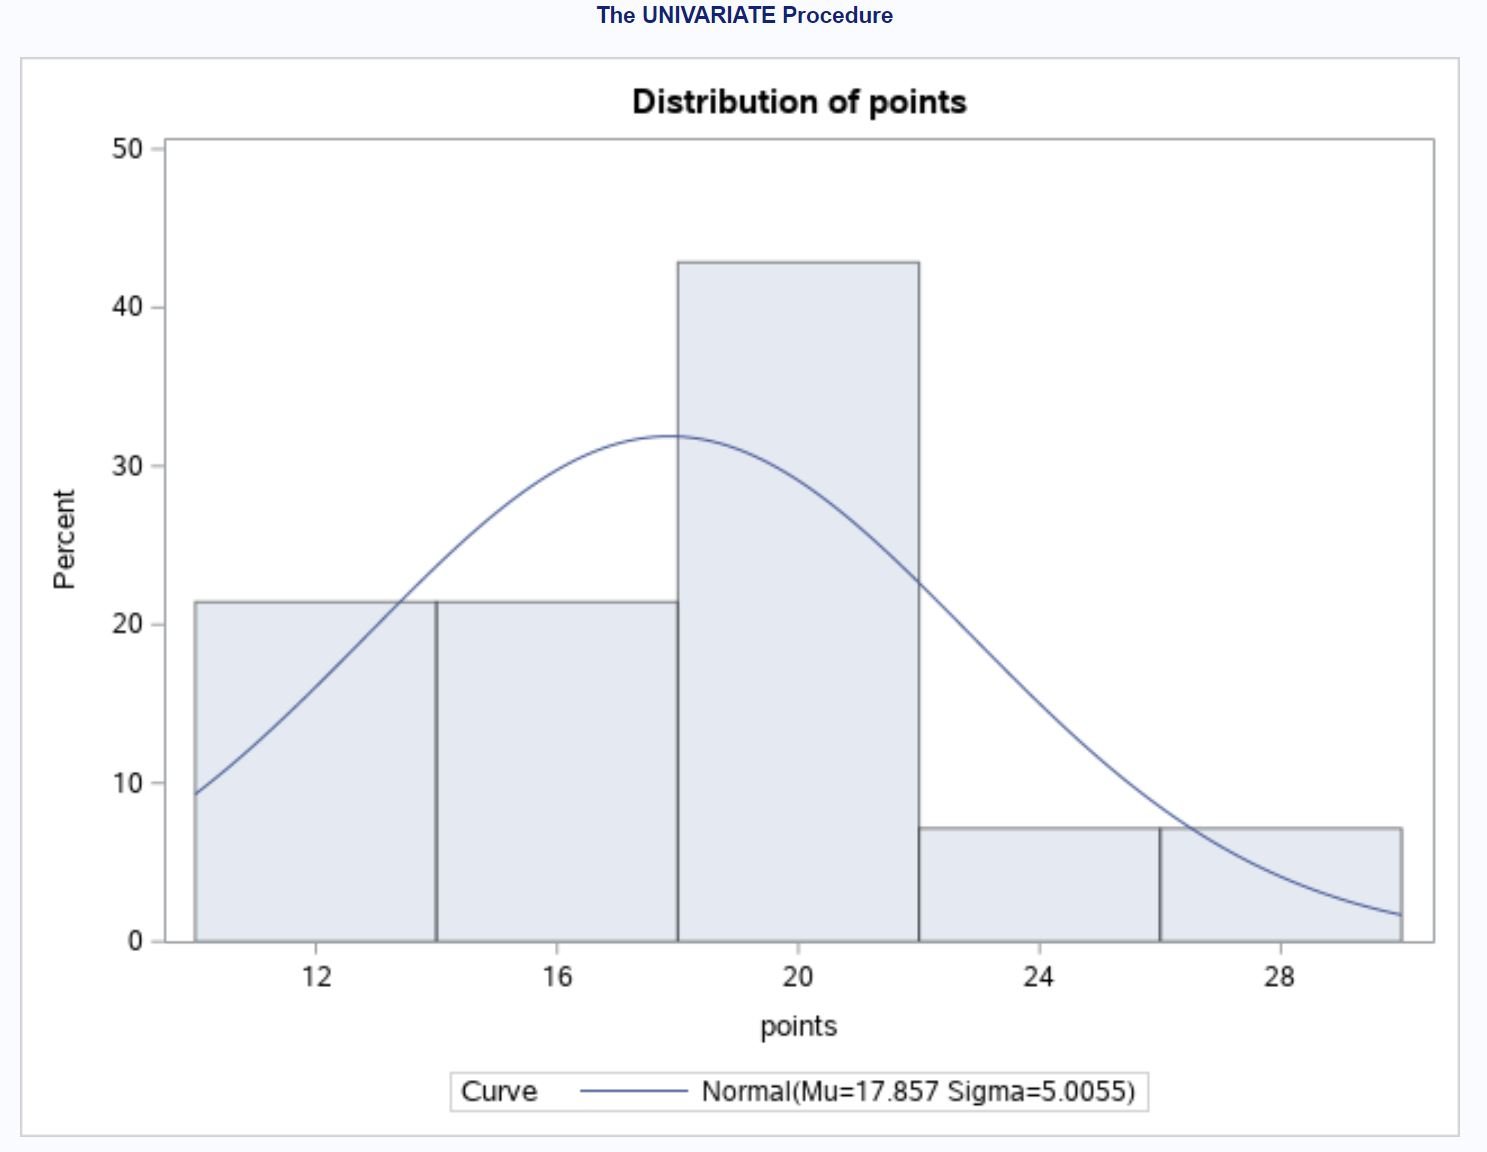
From the histogram we can see that the distribution of values doesn’t follow the normal curve very well, which agrees with the results of the normality tests that we performed.
Additional Resources
The following tutorials explain how to perform other common tasks in SAS:
How to Use Proc Summary in SAS
How to Use Proc Tabulate in SAS
How to Use Proc Rank in SAS