There are two common ways to use the geom_bar() function in ggplot2 to create bar charts:
Method 1: Use geom_bar()
ggplot(df, aes(x)) +
  geom_bar()
By default, geom_bar() will simply count the occurrences of each unique value for the x variable and use bars to display the counts.
Method 2: Use geom_bar(stat=”identity”)
ggplot(df, aes(x, y)) +
  geom_bar(stat="identity")
If you provide the argument stat=”identity” to geom_bar() then you’re telling R to calculate the sum of the y variable, grouped by the x variable and use bars to display the sums.
The following examples illustrate the difference between these two methods using the following data frame in R that shows the points scored by basketball players on various teams:
#create data frame
df frame(team=rep(c('A', 'B', 'C'), each=4),
                 points=c(3, 5, 5, 6, 5, 7, 7, 8, 9, 9, 9, 8))

#view data frame
df

   team points
1     A      3
2     A      5
3     A      5
4     A      6
5     B      5
6     B      7
7     B      7
8     B      8
9     C      9
10    C      9
11    C      9
12    C      8
Example 1: Using geom_bar()
The following code shows how to use the geom_bar() function to create a bar chart that displays the count of each unique value in the team column:
library(ggplot2)

#create bar chart to visualize occurrence of each unique value in team column
ggplot(df, aes(team)) +
  geom_bar()

The x-axis displays the unique values in the team column and the y-axis displays the number of times each unique value occurred.
Since each unique value occurred 4 times, the height of each bar is 4 in the plot.
Example 2: Using geom_bar(stat=”identity”)
The following code shows how to use the geom_bar() function with the stat=”identity” argument to create a bar chart that displays the sum of values in the points column, grouped by team:
library(ggplot2)

#create bar chart to visualize sum of points, grouped by team
ggplot(df, aes(team, points)) +
  geom_bar(stat="identity")

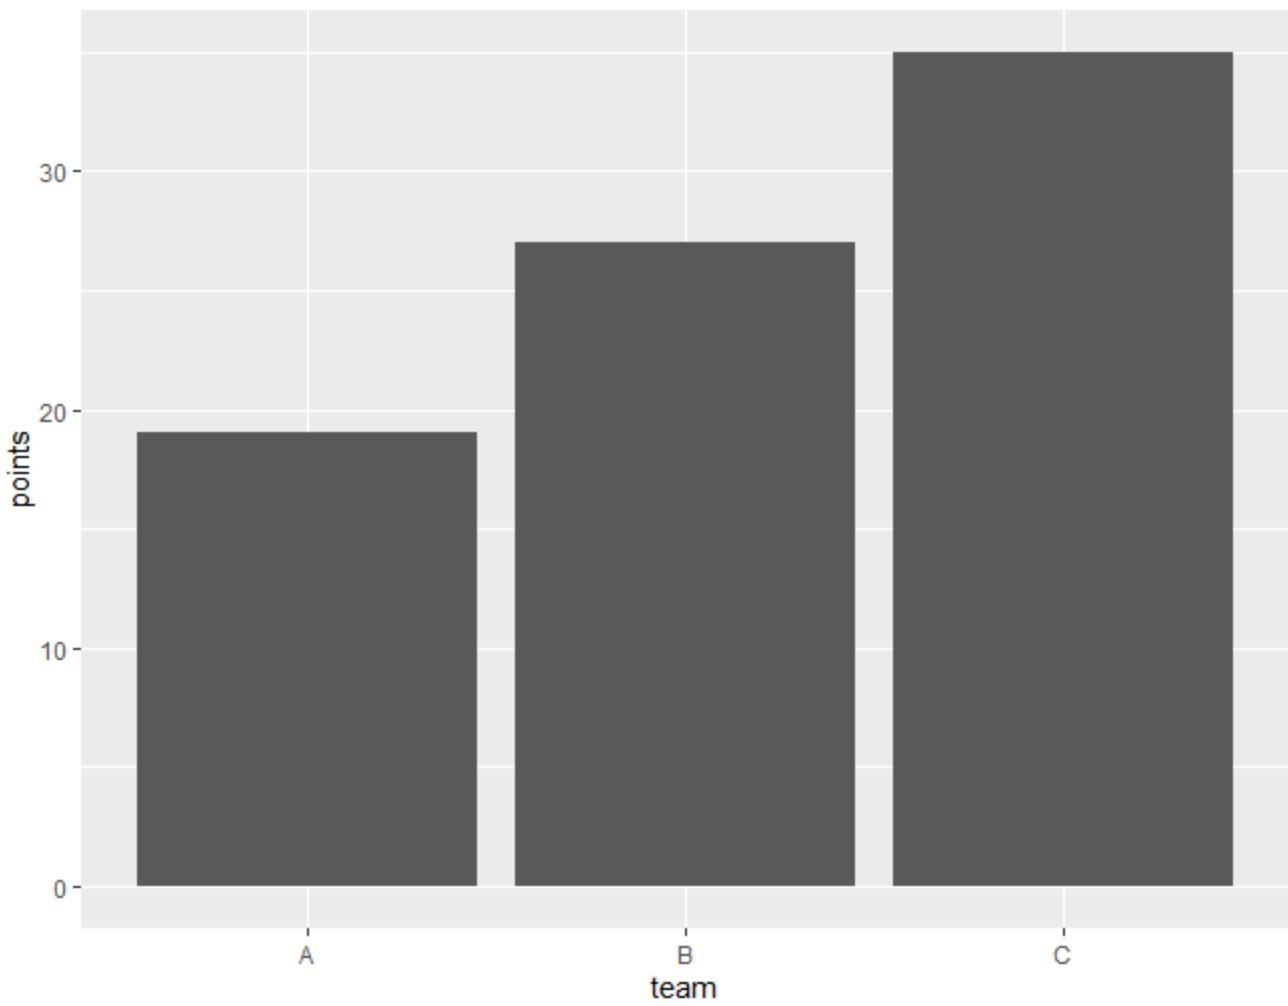
The x-axis displays the unique values in the team column and the y-axis displays the sum of the values in the points column for each team.
For example:
- The sum of points for team A is 19.
- The sum of points for team B is 27.
- The sum of points for team C is 35.
By using stat=”identity” in the geom_bar() function, we’re able to display the sum of values for a particular variable in our data frame instead of counts.
Note: For stat=”identity” to work properly, you must provide both an x variable and a y variable in the aes() argument.
Additional Resources
The following tutorials explain how to perform other common tasks in ggplot2:
How to Adjust Space Between Bars in ggplot2
How to Remove NAs from Plot in ggplot2
How to Change Colors of Bars in Stacked Bart Chart in ggplot2
