108
You can use the following syntax to create boxplots from a pandas DataFrame:
#create boxplot of one column
df.boxplot(column=['col1'])

#create boxplot of multiple columns
df.boxplot(column=['col1', 'col2'])

#create boxplot grouped by one column
df.boxplot(column=['col1'], by='col2')
The following examples show how to use this syntax in practice with the following DataFrame:
import pandas as pd

#create DataFrame
df = pd.DataFrame({'conference': ['A', 'A', 'A', 'B', 'B', 'B'],
                   'points': [5, 7, 7, 9, 12, 9],
                   'assists': [11, 8, 10, 6, 6, 5],
                   'rebounds': [4, 2, 5, 8, 6, 11],})

#view DataFrame
df
Example 1: Boxplot of One Column
The following code shows how to create a boxplot for one column in a pandas DataFrame:
df.boxplot(column=['points'], grid=False, color='black')

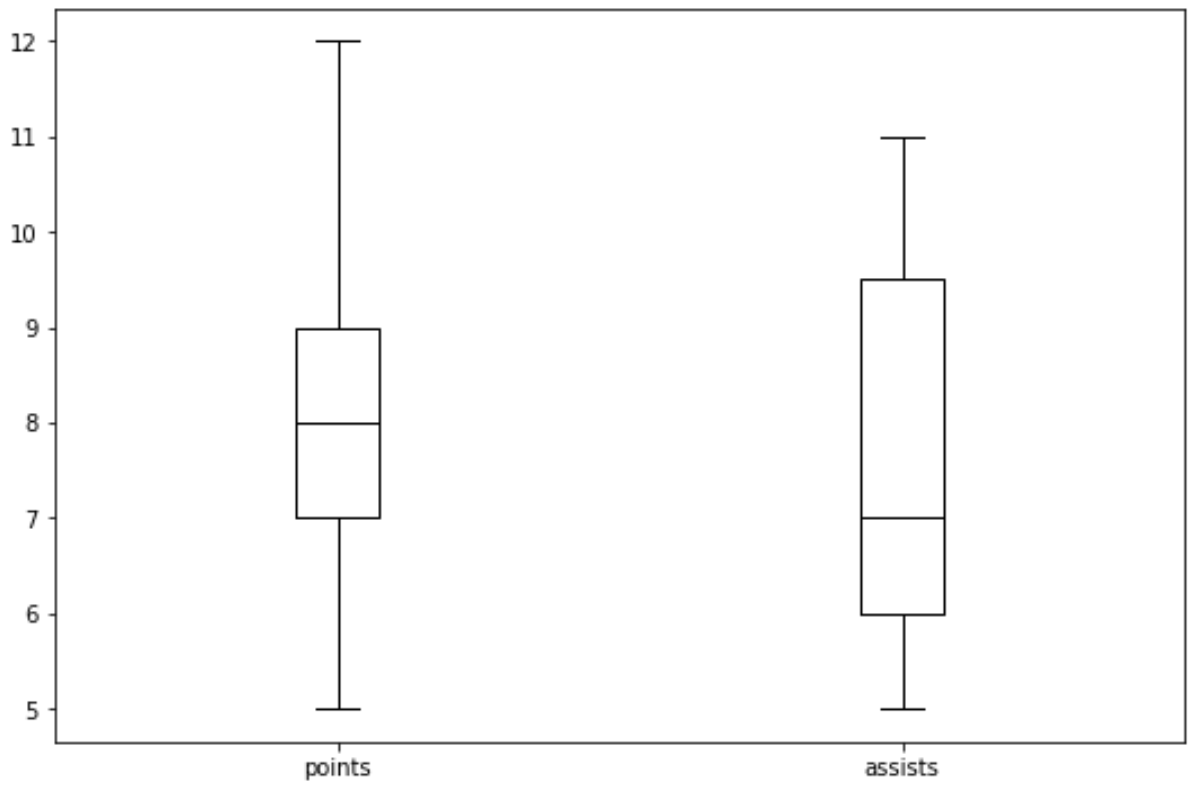
Example 2: Boxplot of Multiple Columns
The following code shows how to create a boxplot for multiple columns in a pandas DataFrame:
df.boxplot(column=['points', 'assists'], grid=False, color='black')
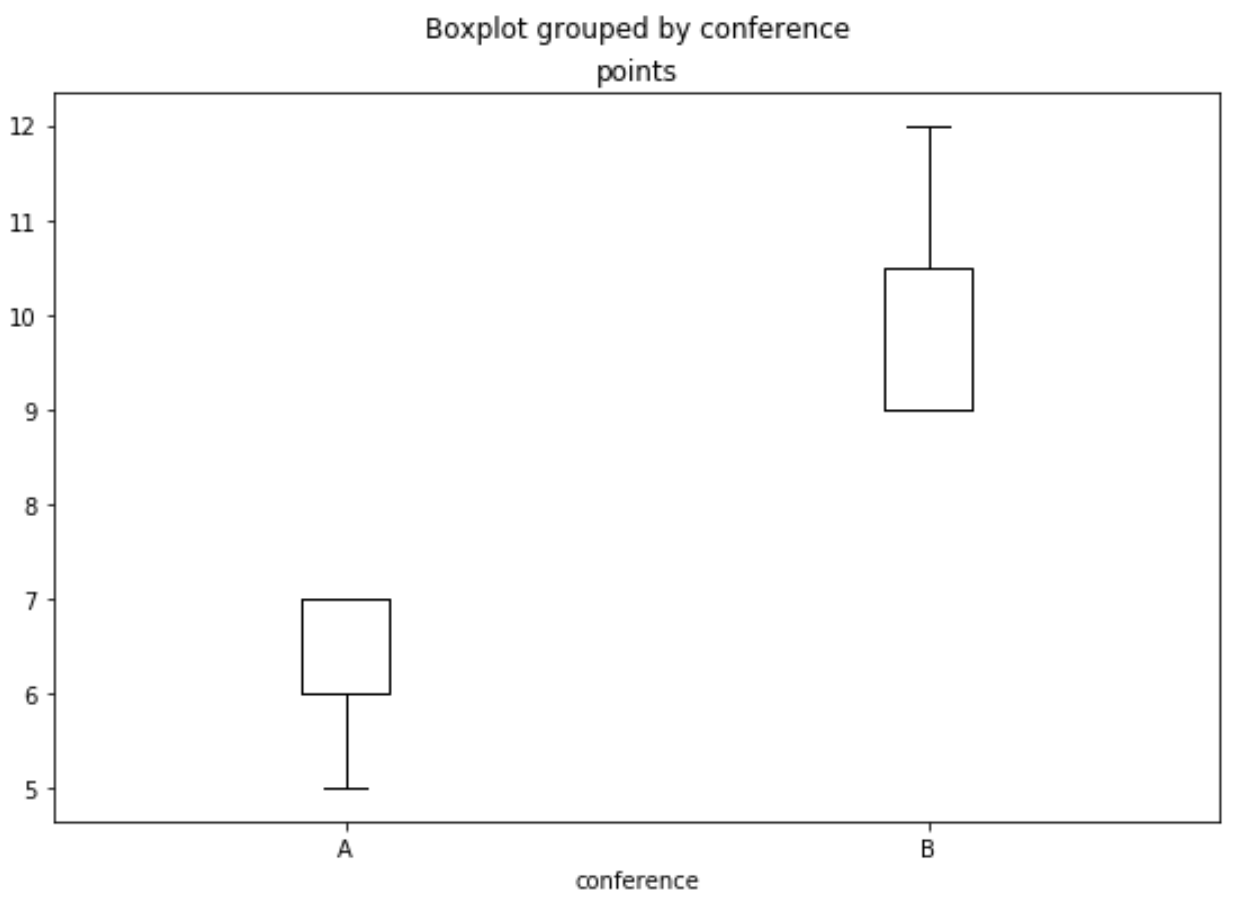
Example 3: Boxplot Grouped by One Column
The following code shows how to create a boxplot grouped by one column in a pandas DataFrame:
df.boxplot(column=['points'], by='conference', grid=False, color='black')
Additional Resources
Pandas: How to Plot Multiple Series
Pandas: How to Plot Multiple Columns on Bar Chart