In statistics, variables can be classified as either categorical or quantitative.
Categorical Variables: Variables that take on names or labels. Examples include:
- Marital status (“married”, “single”, “divorced”)
- Smoking status (“smoker”, “non-smoker”)
- Eye color (“blue”, “green”, “hazel”)
- Level of education (e.g. “high school”, “Bachelor’s degree”, “Master’s degree”)
Quantitative Variables: Variables that take on numerical values. Examples include:
- Height of an individual
- Population size of a city
- Number of students in a class
- Number of square feet in a house
The following table summarizes the difference between these two types of variables:

Examples: Categorical vs. Quantitative Variables
Use the following examples to gain a better understanding of categorical vs. quantitative variables.
Example 1: Plant Height
A botanist walks around a local forest and measures the height of a certain species of plant. The variable plant height is a quantitative variable because it takes on numerical values. For example, the height could be 15 inches, 17.5 inches, 19.2 inches, etc.
Example 2: Vacation Locations
A researcher surveys 200 people and asks them about their favorite vacation location. The variable vacation location is a categorical variable because it takes on names. For example, responses could include “Miami”, “San Francisco”, “Hilton Head”, etc.
Example 3: Political Party
A political scientists surveys 50 people in a certain town and asks them which political party they identify with. The variable political party is a categorical variable because it takes on labels. For example, responses could include “Democrat”, “Republican”, “Independent”, etc.
Example 4: Running Times
A coach records the running times of his 20 track runners. The variable running time is a quantitative variable because it takes on numerical values. For example, running time could be 58 seconds, 60.343 seconds, 65.4 seconds, etc.
Example 5: House Prices
An economist collects data about house prices in a certain city. The variable house price is a quantitative variable because it takes on numerical values. For example, house price could be $149,000, $289,000, $560,000, etc.
How to Describe Categorical & Quantitative Variables
We can summarize categorical variables by using frequency tables.
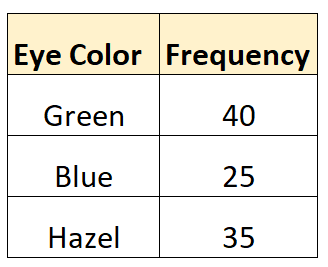
For example, suppose we collect data on the eye color of 100 individuals. Since “eye color” is a categorical variable, we might use the following frequency table to summarize its values:

We can summarize quantitative variables using a variety of descriptive statistics.
For example, suppose we collect data on the square footage of 100 homes. Since “square footage” is a quantitative variable, we might use the following descriptive statistics to summarize its values:
- Mean: 1,800
- Median: 2,150
- Mode: 1,600
- Range: 6,500
- Interquartile Range: 890
- Standard Deviation: 235
These metrics give us an idea of where the center value is located as well as how spread out the values are for this variable.
Related: How to Plot Categorical Data in R
