Often you may want to calculate a cumulative percentage of some dataset. Fortunately this is easy to do using built-in functions in Excel.
The following step-by-step example shows how to calculate cumulative percentages in Excel.
Step 1: Enter the Data
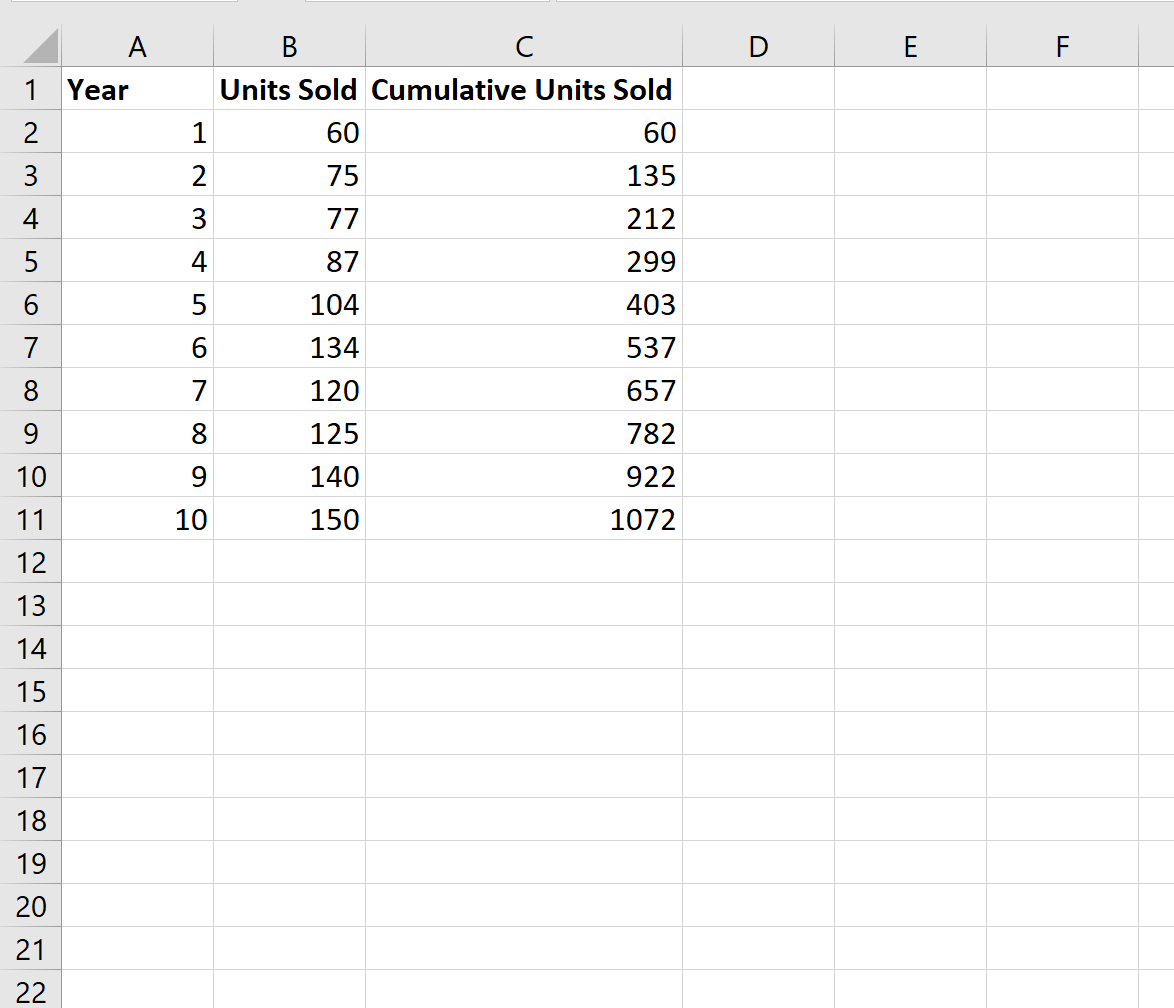
First, let’s create a dataset that shows the number of units that some company sells during consecutive years:

Step 2: Calculate Cumulative Frequency
Next, let’s use the following formula to calculate the cumulative frequency of the first row:

We can then copy and paste this formula to each remaining cell in column C:
Step 3: Calculate Cumulative Percentage
Next, we can use the following formula to calculate the cumulative percentage of the first row:

We can then copy and paste this formula to the remaining cells in column D:

Step 4: Change Formatting to Percentage
Lastly, we can highlight each of the cumulative percentage values in column D and then press Ctrl+Shift+% to convert the formatting to percentages:

We interpret the cumulative percentages as follows:
- About 6% of all sales were made in year 1.
- About 13% of all sales were made in years 1 and 2 combined.
- About 20% of all sales were made in years 1, 2, and 3 combined.
And so on.
Additional Resources
How to Calculate Cumulative Frequency in Excel
How to Calculate a Cumulative Average in Excel
How to Calculate Moving Averages in Excel
How to Calculate Ratios in Excel