Fleiss’ Kappa is a way to measure the degree of agreement between three or more raters when the raters are assigning categorical ratings to a set of items.
Fleiss’ Kappa ranges from 0 to 1 where:
- 0 indicates no agreement at all among the raters.
- 1 indicates perfect inter-rater agreement.
This tutorial provides an example of how to calculate Fleiss’ Kappa in Excel.
Example: Fleiss’ Kappa in Excel
Suppose 14 individuals rate 10 different products on a scale of Poor to Excellent.
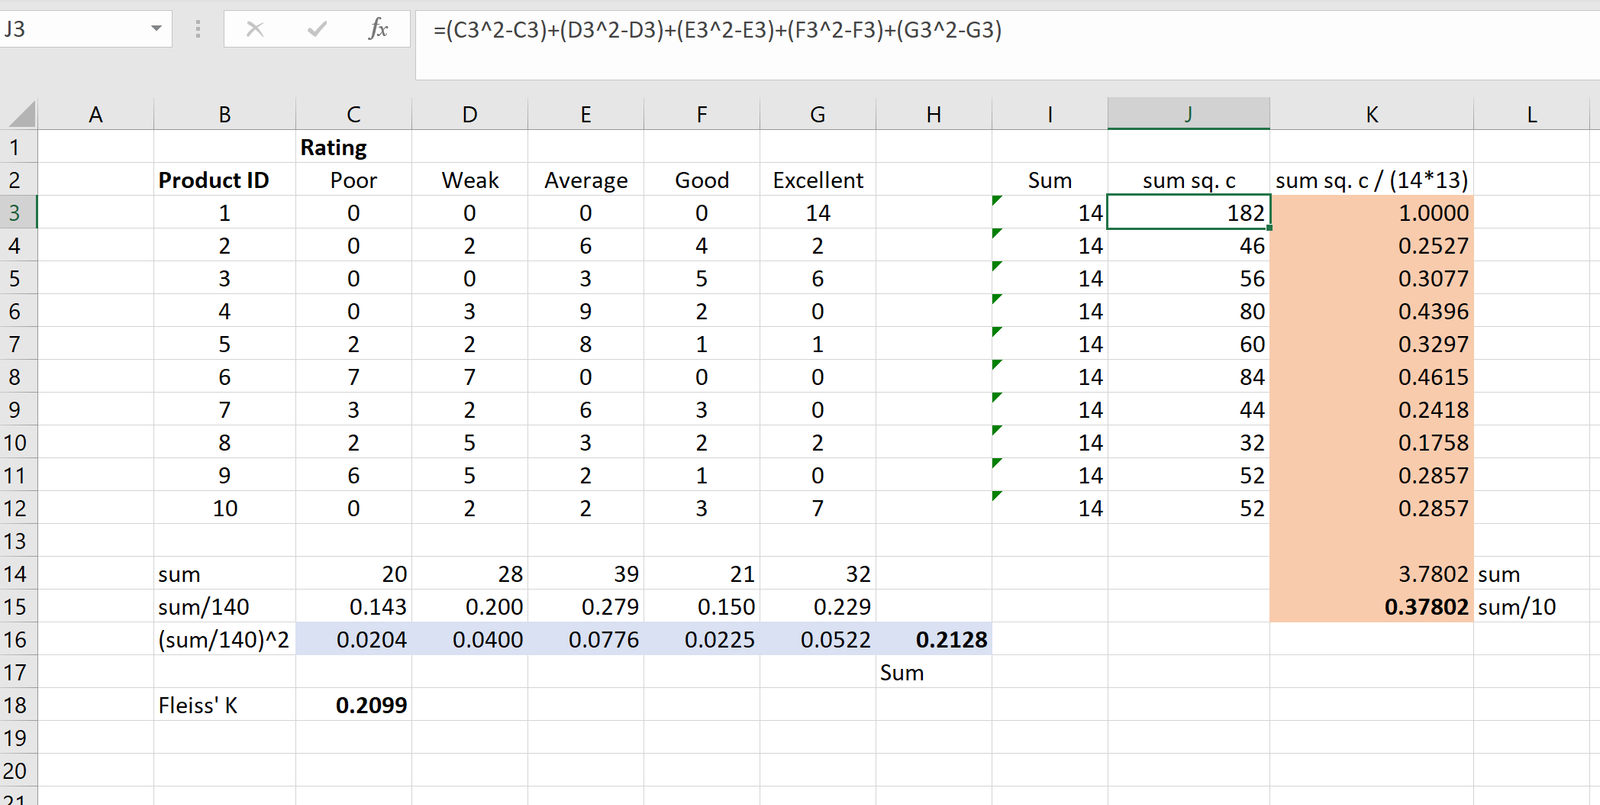
The following screenshot displays the total ratings that each product received:

The following screenshot shows how to calculate Fleiss’ Kappa for this data in Excel:

The trickiest calculations in this screenshot are in column J. The formula used for these calculations is shown in the text box near the top of the screen.
Note that the Fleiss’ Kappa in this example turns out to be 0.2099. The actual formula used to calculate this value in cell C18 is:
Fleiss’ Kappa = (0.37802 – 0.2128) / (1 – 0.2128) = 0.2099.
Although there is no formal way to interpret Fleiss’ Kappa, the following values show how to interpret Cohen’s Kappa, which is used to assess the level of inter-rater agreement between just two raters:
- .21 – .40 | Fair
- .41 – .60 | Moderate
- .61 – .80 | Good
- .81 – 1 | Very Good
Based on these values, Fleiss’ Kappa of 0.2099 in our example would be interpreted as a “fair” level of inter-rater agreement.
