You can use the following syntax to modify the axis label position in ggplot2:
theme(axis.title.x = element_text(margin=margin(t=20)), #add margin to x-axis title
      axis.title.y = element_text(margin=margin(r=60))) #add margin to y-axis title
Note that you can specify t, r, b, l for the margin argument, which stands for top, right, bottom, and left.
The following examples show how to use this syntax in practice.
Example 1: Set X-Axis Label Position
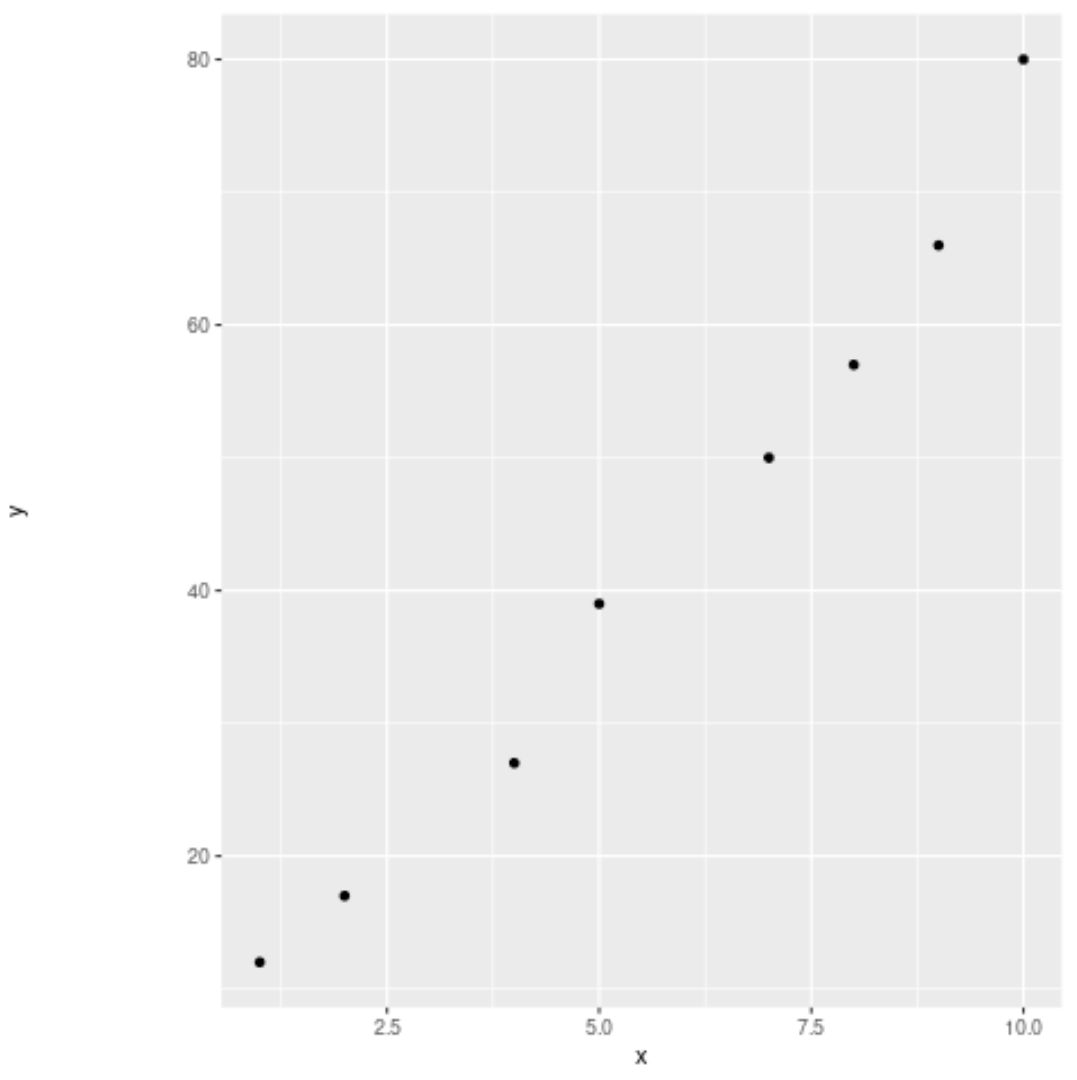
Suppose we create the following scatterplot using ggplot2:
library(ggplot2)

#create data frame
df frame(x=c(1, 2, 4, 5, 7, 8, 9, 10),
                 y=c(12, 17, 27, 39, 50, 57, 66, 80))

#create scatterplot of x vs. y
ggplot(df, aes(x=x, y=y)) +
  geom_point()

We can add a margin to the top of the x-axis title to make the x-axis title appear further from the axis:
#create scatterplot of x vs. y with margin added on x-axis title
ggplot(df, aes(x=x, y=y)) +
  geom_point() +
  theme(axis.title.x = element_text(margin = margin(t = 70)))

Notice that we added a significant amount of spacing between the x-axis title and the x-axis.
Example 2: Set Y-Axis Label Position
We can use the following code to add a margin to the right of the y-axis title to make the y-axis title appear further from the axis:
#create scatterplot of x vs. y with margin added on y-axis title
ggplot(df, aes(x=x, y=y)) +
  geom_point() +
  theme(axis.title.y = element_text(margin = margin(r = 70)))

Notice that we added significant spacing between the y-axis title and the y-axis.
Additional Resources
The following tutorials explain how to perform other commonly used operations in ggplot2:
How to Rotate Axis Labels in ggplot2
How to Set Axis Breaks in ggplot2
How to Set Axis Limits in ggplot2
How to Change Legend Labels in ggplot2
