You can use the following methods to adjust the space between bars in ggplot2 bar charts:
Method 1: Adjust Spacing Between Bars in Bar Chart
ggplot(df, aes(x=x_variable)) +
  geom_bar(width=.4)
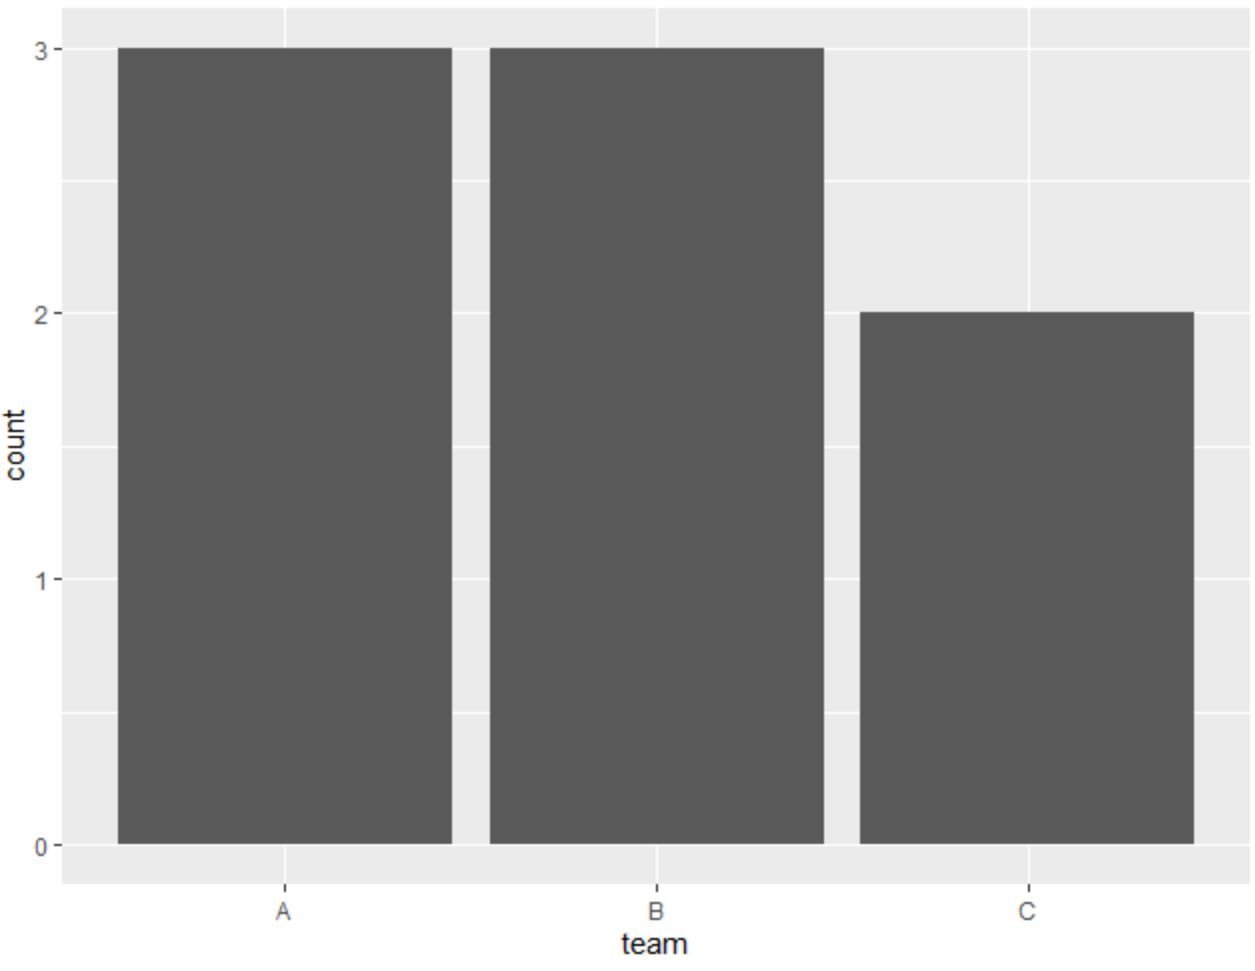
The default width between bars is 0.9.
The closer the width is to 1, the closer together the bars will be. The close the width is to 0, the more spread out the bars will be.
Method 2: Adjust Spacing Between Bars in Clustered Bar Chart
ggplot(df, aes(x=x_variable, y=y_variable, fill=fill_variable)) +
  geom_bar(width=.5, stat='identity', position=position_dodge(.7))
The width value controls the spacing between clusters while the position_dodge() value controls the spacing between bars within the same cluster.
The following examples show how to use each method in practice with the following data frame in R:
#create data frame
df frame(team=c('A', 'A', 'A', 'B', 'B', 'B', 'C', 'C'),
                 position=c('G', 'G', 'F', 'G', 'F', 'F', 'F', 'G'),
                 points=c(12, 22, 24, 23, 20, 15, 11, 30))

#view data frame
df

  team position points
1    A        G     12
2    A        G     22
3    A        F     24
4    B        G     23
5    B        F     20
6    B        F     15
7    C        F     11
8    C        G     30
Example 1: Adjust Spacing Between Bars in Bar Chart
The following code shows how to create a bar chart to visualize the occurrences of each team using the default width spacing of 0.9:
library(ggplot2)

#create bar plot with default spacing
ggplot(df, aes(x=team)) +
  geom_bar()

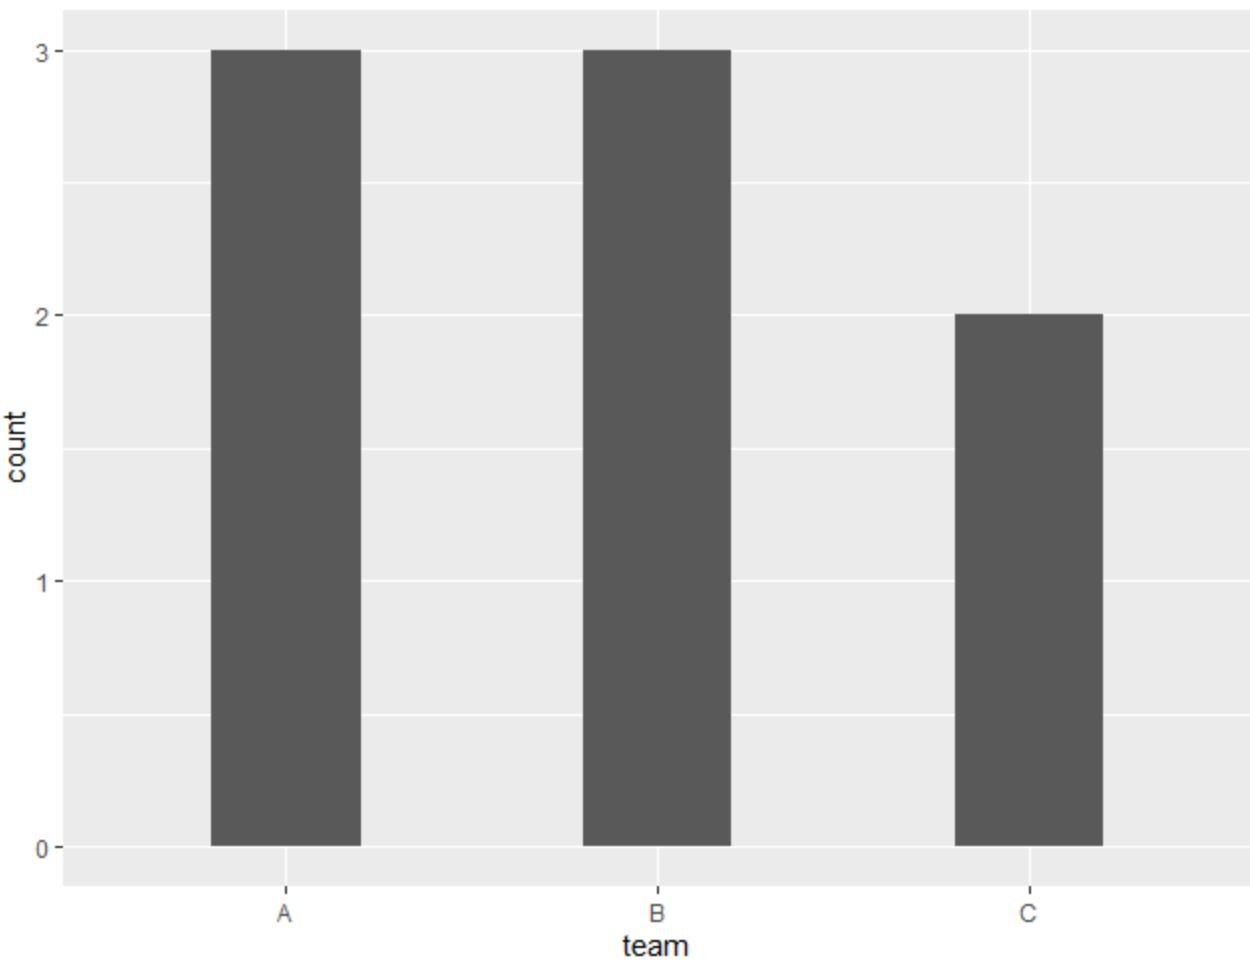
And the following code shows how to increase the space between the bars by decreasing the value for the width argument to 0.4:
library(ggplot2)

#create bar plot with increased spacing
ggplot(df, aes(x=team)) +
  geom_bar(width=.4)

By decreasing the value for the width argument, we increased the spacing between the bars.
Example 2: Adjust Spacing Between Bars in Clustered Bar Chart
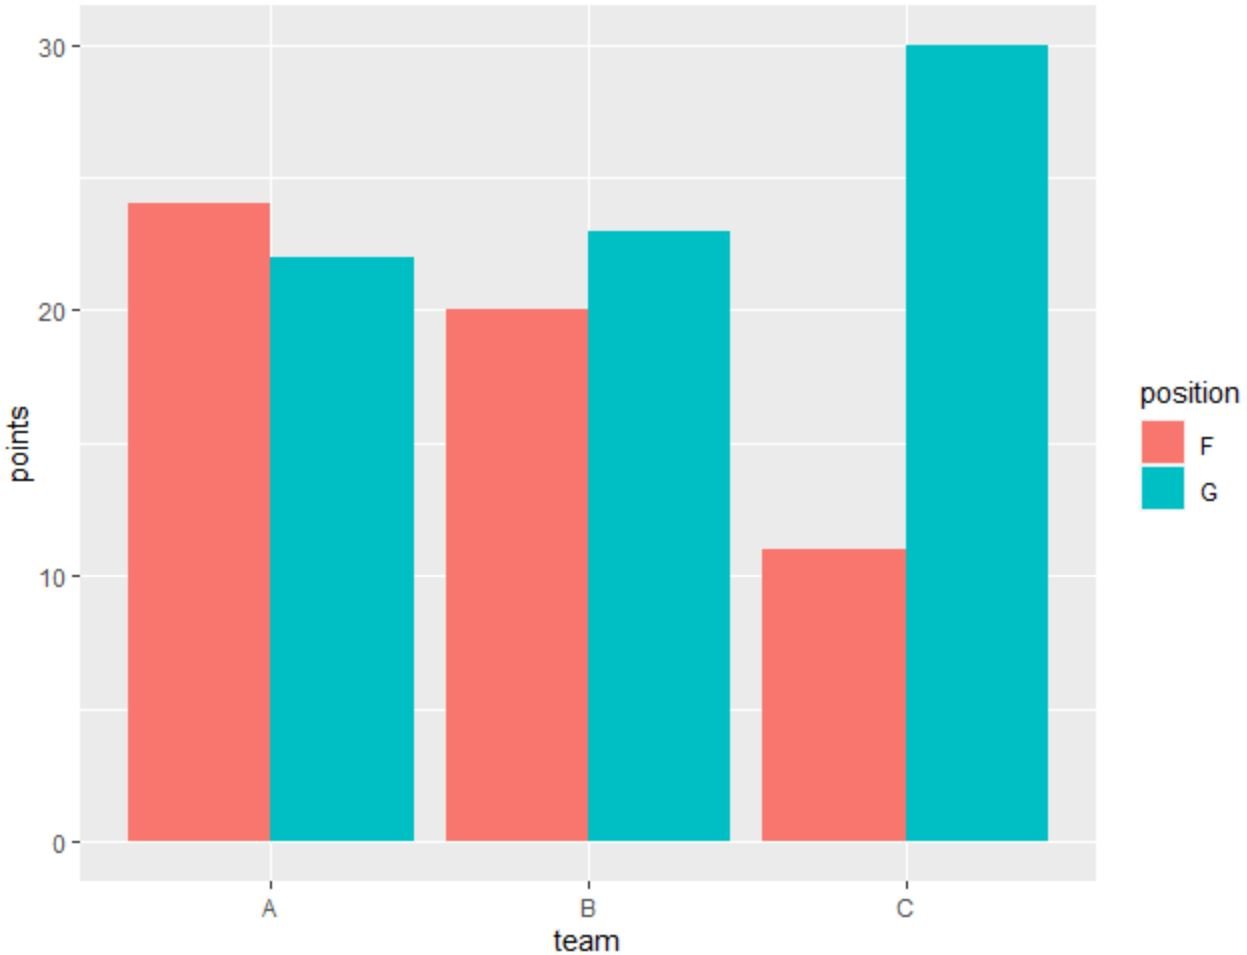
The following code shows how to create a clustered bar chart to visualize the total points scored by team and position:
library(ggplot2)

#create clustered bar plot with default spacing
ggplot(df, aes(x=team, y=points, fill=position)) +
  geom_bar(stat='identity', position='dodge')

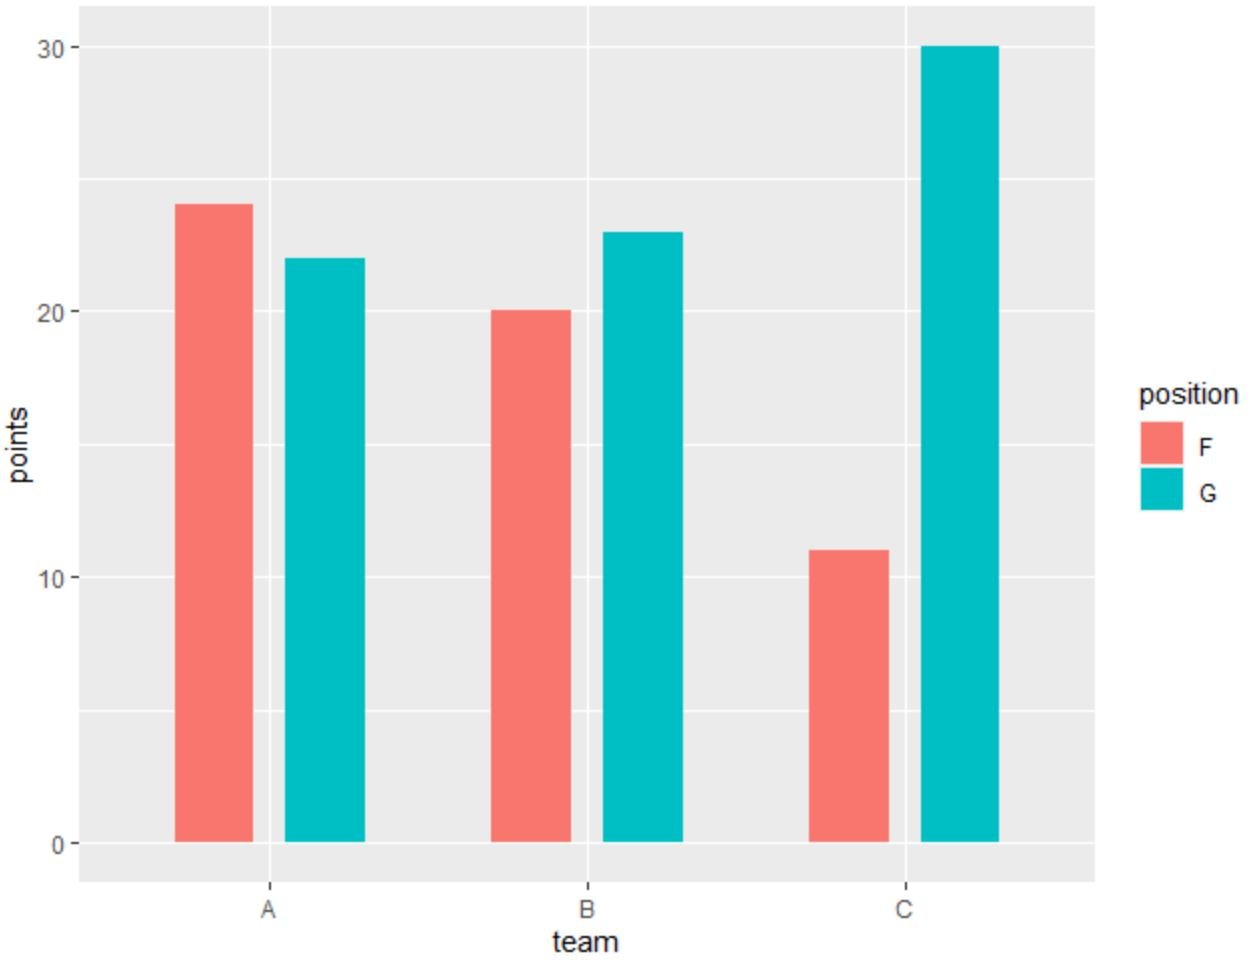
And the following code shows how to increase both the space between the clustered bars and the space between bars within the same cluster:
library(ggplot2)

#create clustered bar plot with increased spacing
ggplot(df, aes(x=team, y=points, fill=position)) +
  geom_bar(width=.5, stat='identity', position=position_dodge(.7))

By decreasing the value for width, we increased the spacing between the clusters.
And by decreasing the value for position_dodge(), we increased the spacing between bars within the same clusters.
Feel free to play around with the values for both of these arguments to make the bar chart appear exactly how you’d like.
Additional Resources
The following tutorials explain how to perform other common tasks in ggplot2:
How to Order the Bars in a ggplot2 Bar Chart
How to Reorder Bars in a Stacked Bar Chart in ggplot2
How to Change Colors of Bars in Stacked Bart Chart in ggplot2
