The data visualization library ggplot2 makes it easy to create beautiful charts in R from scratch.
However, ggplot2 doesn’t provide a title for charts unless you specify one. This tutorial explains exactly how to add and modify titles on ggplot2 charts.
How to Add a ggplot2 Title
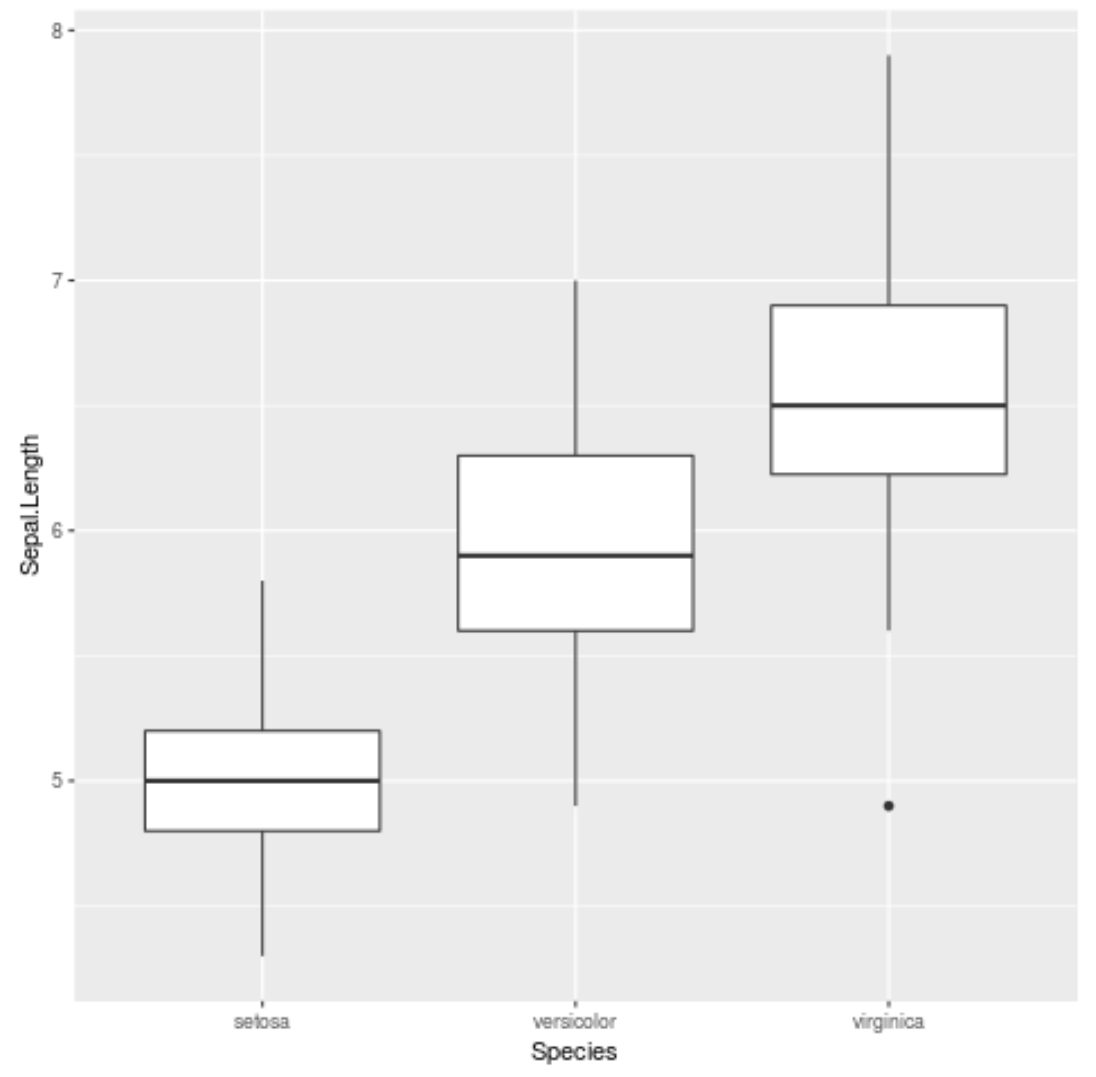
The following code shows how to use ggplot2 to create a grouped boxplot using the built-in iris dataset:
library(ggplot2)

ggplot(iris, aes(x=Species, y=Sepal.Length)) +
  geom_boxplot()
To add a title to the chart, we can use the ggtitle() function:
ggplot(iris, aes(x=Species, y=Sepal.Length)) +
  geom_boxplot() +
  ggtitle('Sepal Length by Species')
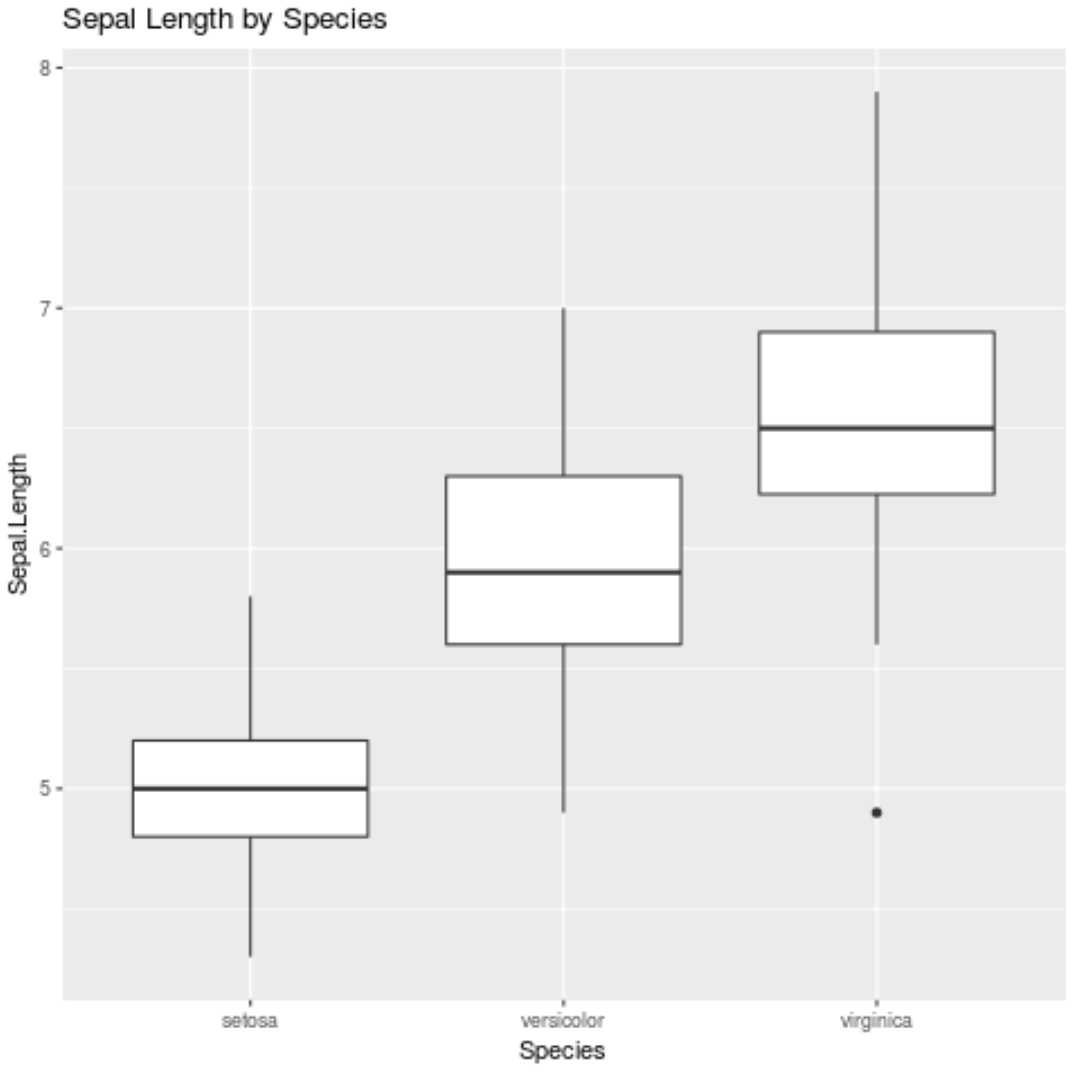
Note: You could also use labs(title=’Sepal Length by Species’) to create the exact same title.
How to Center a ggplot2 Title
By default, ggplot2 titles are left-aligned. The creator of ggplot2, Hadley Wickham, notes that this is because a left-aligned title works better with subtitles.
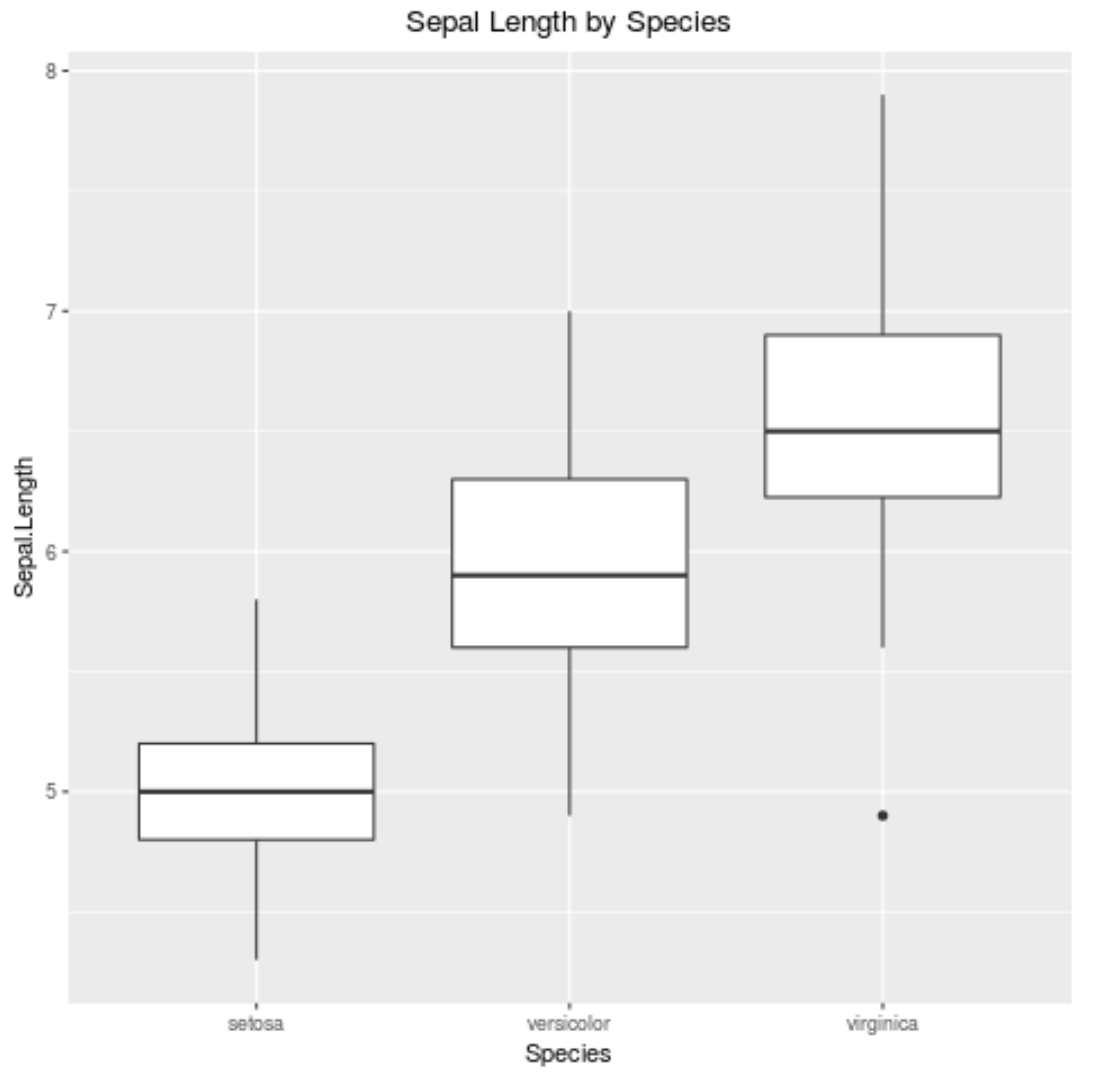
If you’d like to center a ggplot2 title, you can use this bit of code:
theme(plot.title = element_text(hjust = 0.5))
Here’s what that looks like in practice:
ggplot(iris, aes(x=Species, y=Sepal.Length)) +
  geom_boxplot() +
  ggtitle('Sepal Length by Species') +
  theme(plot.title = element_text(hjust = 0.5))
How to Modify the Font of a ggplot2 Title
You can modify many aspects of the font title, including:
- family: font family
- face: font face. Options include “italic”, “bold”, and “bold.italic”
- color: font color
- size: font size in pts
- hjust: horizontal justification between 0 and 1
- vjust: vertical justification between 0 and 1
- lineheight: line height, i.e. the spaceing between lines for multi-line titles
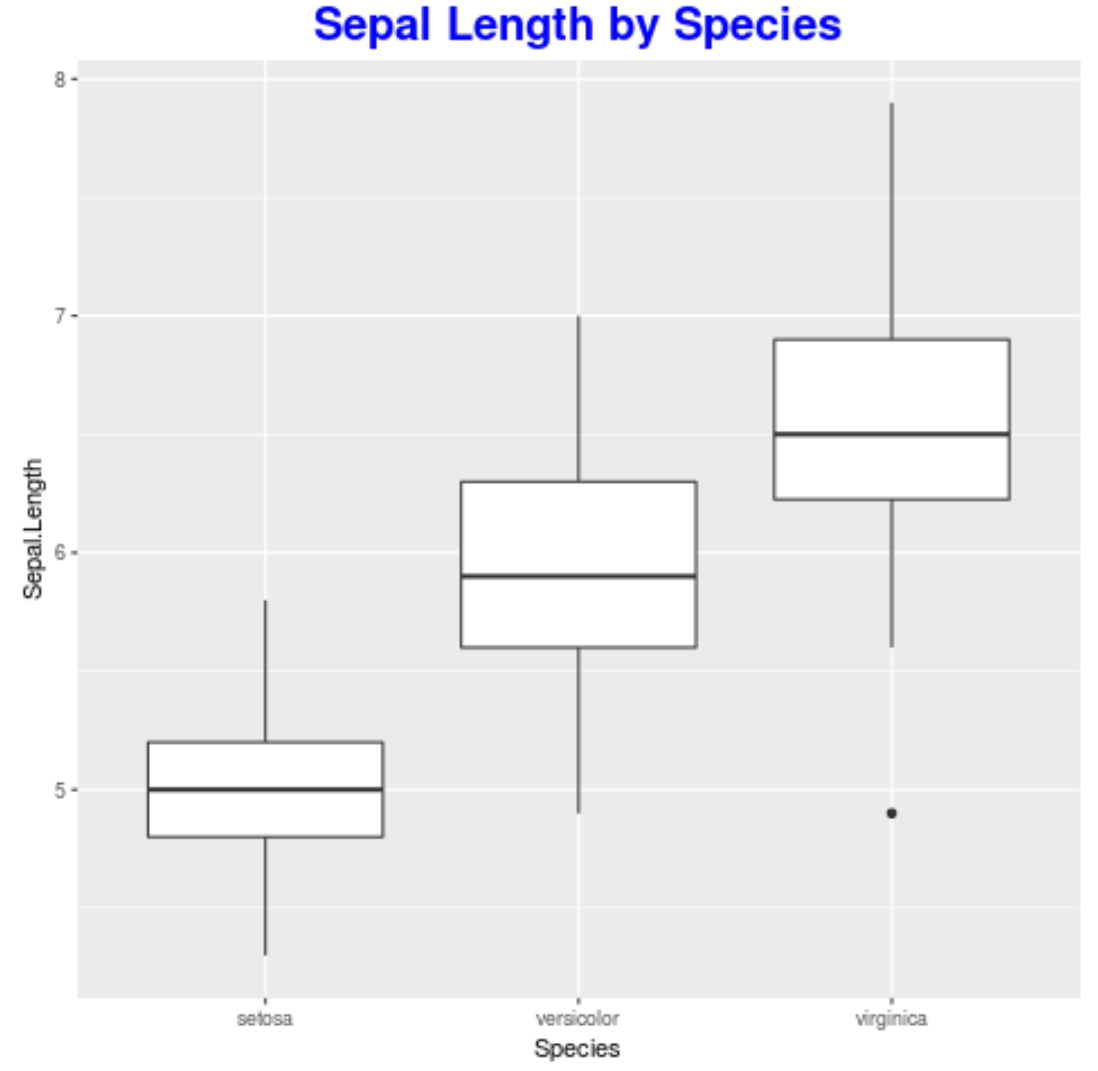
Here’s an example of how to modify a few of these aspects:
ggplot(iris, aes(x=Species, y=Sepal.Length)) +
  geom_boxplot() +
  ggtitle('Sepal Length by Species') +
  theme(plot.title = element_text(hjust=0.5, color="blue", size=20, face="bold"))
How to Create a Multi-Line ggplot2 Title
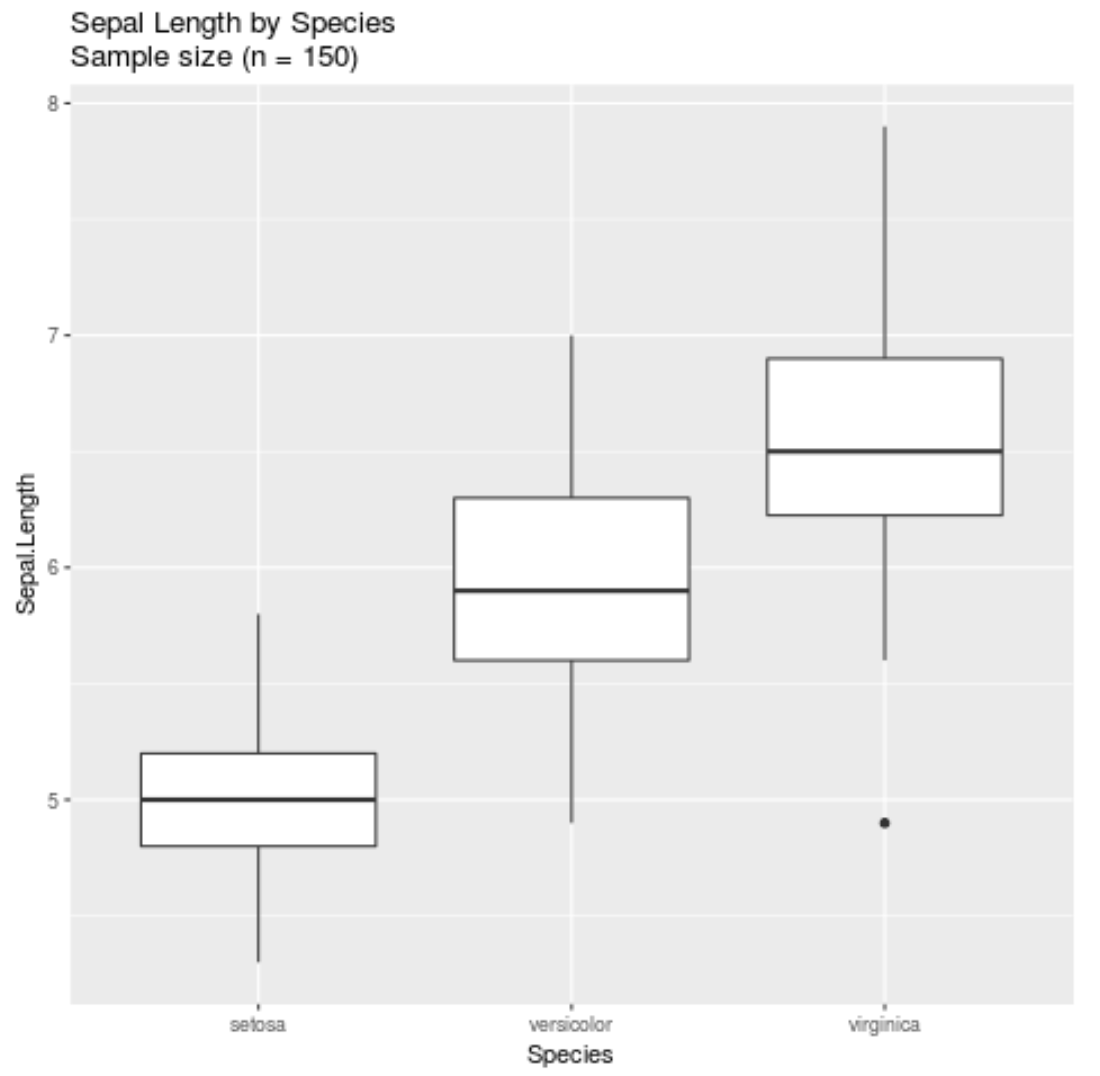
If you have an unusually long title, you can simply throw in n where you’d like a new line to start. For example:
ggplot(iris, aes(x=Species, y=Sepal.Length)) +
  geom_boxplot() +
  ggtitle('Sepal Length by SpeciesnSample size (n = 150)')
Additional Resources
A Complete Guide to the Best ggplot2 Themes
How to Create Side-by-Side Plots in ggplot2
How to Set Axis Limits in ggplot2