Cook’s distance, often denoted Di, is used in regression analysis to identify influential data points that may negatively affect your regression model.
The formula for Cook’s distance is:
Di = (ri2 / p*MSE) * (hii / (1-hii)2)
where:
- ri is the ith residual
- p is the number of coefficients in the regression model
- MSE is the mean squared error
- hii is the ith leverage value
Although the formula looks a bit complicated, the good news is that most statistical softwares can easily compute this for you.
Essentially, Cook’s Distance does one thing: it measures how much all of the fitted values in the model change when the ith data point is deleted.
A data point that has a large value for Cook’s Distance indicates that it strongly influences the fitted values. A general rule of thumb is that any point with a Cook’s Distance over 4/n (where n is the total number of data points) is considered to be an outlier.
It’s important to note that Cook’s Distance is often used as a way to identify influential data points. Just because a data point is influential doesn’t mean it should necessarily be deleted – first you should check to see if the data point has simply been incorrectly recorded or if there is something strange about the data point that may point to an interesting finding.
How to Calculate Cook’s Distance in R
The following example illustrates how to calculate Cook’s Distance in R.
First, we’ll load two libraries that we’ll need for this example:
library(ggplot2)
library(gridExtra)
Next, we’ll define two data frames: one with two outliers and one with no outliers.
#create data frame with no outliers
no_outliers #create data frame with two outliers
outliers 190, 23, 24, 23, 19, 34, 35, 36, 36, 34, 32, 38, 41,
                             42, 180))
Next, we’ll create a scatterplot to display the two data frames side by side:
#create scatterplot for data frame with no outliers
no_outliers_plot #create scatterplot for data frame with outliers
outliers_plot #plot the two scatterplots side by side
gridExtra::grid.arrange(no_outliers_plot, outliers_plot, ncol=2) 
We can see how outliers negatively influence the fit of the regression line in the second plot.
To identify influential points in the second dataset, we can can calculate Cook’s Distance for each observation in the dataset and then plot these distances to see which observations are larger than the traditional threshold of 4/n:
#fit the linear regression model to the dataset with outliers
model #find Cook's distance for each observation in the dataset
cooksD # Plot Cook's Distance with a horizontal line at 4/n to see which observations
#exceed this thresdhold
n # add cutoff line
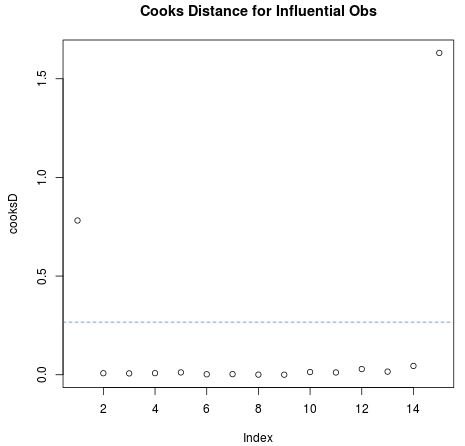
We can clearly see that the first and last observation in the dataset exceed the 4/n threshold. Thus, we would identify these two observations as influential data points that have a negative impact on the regression model.
If we would like to remove any observations that exceed the 4/n threshold, we can do so using the following code:
#identify influential points
influential_obs  (4/n))])

#define new data frame with influential points removed
outliers_removed
Next, we can compare two scatterplots: one shows the regression line with the influential points present and the other shows the regression line with the influential points removed:
#create scatterplot with outliers present
outliers_present #create scatterplot with outliers removed
outliers_removed #plot both scatterplots side by side
gridExtra::grid.arrange(outliers_present, outliers_removed, ncol = 2) 
We can clearly see how much better the regression line fits the data with the two influential data points removed.
Technical Notes
- Most statistical softwares have the ability to easily compute Cook’s Distance for each observation in a dataset.
- Keep in mind that Cook’s Distance is simply a way to identify influential points.
- There are many ways to deal with influential points including: removing these points, replacing these points with some value like the mean or median, or simply keeping the points in the model but making a careful note about this when reporting the regression results.