The hypergeometric distribution describes the probability of choosing k objects with a certain feature in n draws without replacement, from a finite population of size N that contains K objects with that feature.
If a random variable X follows a hypergeometric distribution, then the probability of choosing k objects with a certain feature can be found by the following formula:
P(X=k) = KCk (N-KCn-k) / NCn
where:
- N: population size
- K: number of objects in population with a certain feature
- n: sample size
- k: number of objects in sample with a certain feature
- KCk: number of combinations of K things taken k at a time
To calculate probabilities related to the hypergeometric distribution in Excel, we can use the following formula:
=HYPGEOM.DIST(sample_s, number_sample, population_s, number_pop, cumulative)
where:
- sample_s: number of successes in sample
- number_sample: size of sample
- population_s: number of successes in population
- number_pop: population size
- cumulative: Whether to calculate the cumulative distribution function
The following examples show how to use this formula in practice.
Example 1: Picking Cards from a Deck
There are 4 Queens in a standard deck of 52 cards. Suppose we randomly pick a card from a deck, then, without replacement, randomly pick another card from the deck. What is the probability that both cards are Queens?
We can use the following formula in Excel to calculate the probability that both cards are Queens:

The probability that both cards are Queens is .00452.
Example 2: Picking Balls from an Urn
An urn contains 3 red balls and 5 green balls. You randomly choose 4 balls. What is the probability that you choose exactly 2 red balls?
We can use the following formula in Excel to find this probability:

The probability that you choose exactly 2 red balls is .428571.
Example 3: Choosing Marbles from a Basket
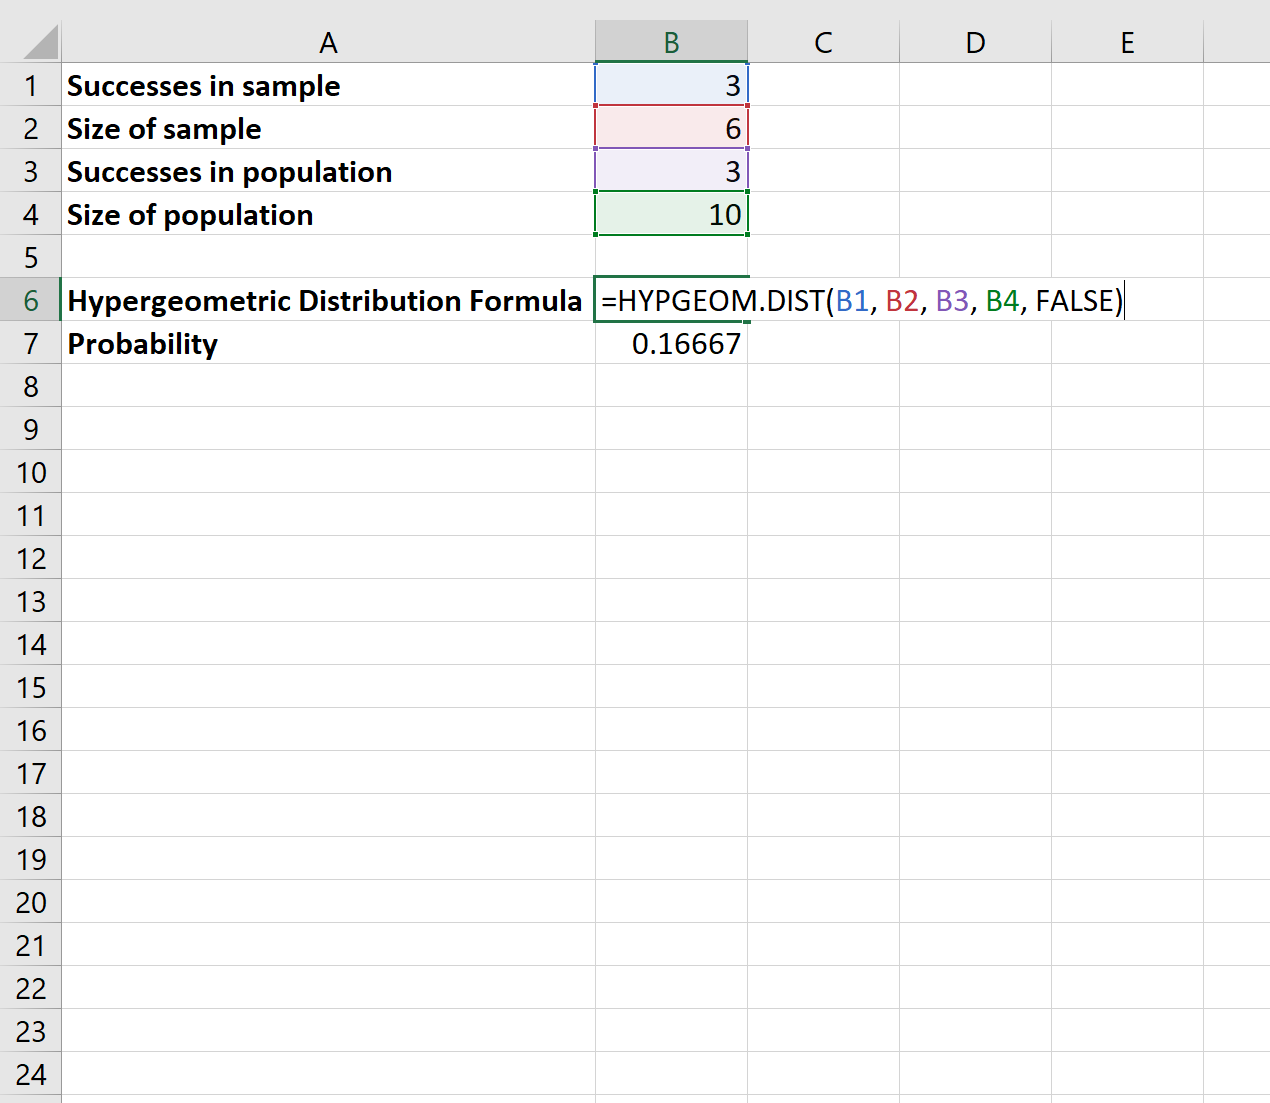
A basket contains 7 purple marbles and 3 pink marbles. You randomly choose 6 marbles. What is the probability that you choose exactly 3 pink marbles?
We can use the following formula in Excel to find this probability:

The probability that you choose exactly 3 pink marbles is .16667.
Additional Resources
An Introduction to the Hypergeometric Distribution
Online Hypergeometric Distribution Calculator
