108
MATLAB area()
An area plot shows items in Y as one or more curves and fills the area beneath each curve. When Y is the matrix, the curves are stacked, presenting the relative contribution of each row item to the total height of the curve at each x interval.
Syntax
Example
Output:
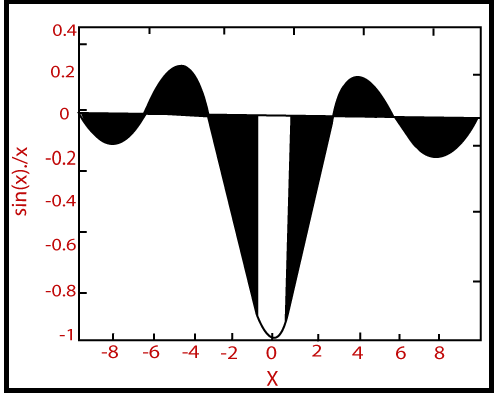
Next TopicMATLAB Pie()