39
You can use one of the two following methods to create tables in Python using Matplotlib:
Method 1: Create Table from pandas DataFrame
#create pandas DataFrame
df = pd.DataFrame(np.random.randn(20, 2), columns=['First', 'Second'])

#create table
table = ax.table(cellText=df.values, colLabels=df.columns, loc='center')
Method 2: Create Table from Custom Values
#create values for table
table_data=[
    ["Player 1", 30],
    ["Player 2", 20],
    ["Player 3", 33],
    ["Player 4", 25],
    ["Player 5", 12]
]

#create table
table = ax.table(cellText=table_data, loc='center')
This tutorial provides examples of how to use these methods in practice.
Example 1: Create Table from pandas DataFrame
The following code shows how to create a table in Matplotlib that contains the values in a pandas DataFrame:
import numpy as np
import pandas as pd
import matplotlib.pyplot as plt

#make this example reproducible
np.random.seed(0)

#define figure and axes
fig, ax = plt.subplots()

#hide the axes
fig.patch.set_visible(False)
ax.axis('off')
ax.axis('tight')

#create data
df = pd.DataFrame(np.random.randn(20, 2), columns=['First', 'Second'])

#create table
table = ax.table(cellText=df.values, colLabels=df.columns, loc='center')

#display table
fig.tight_layout()
plt.show()

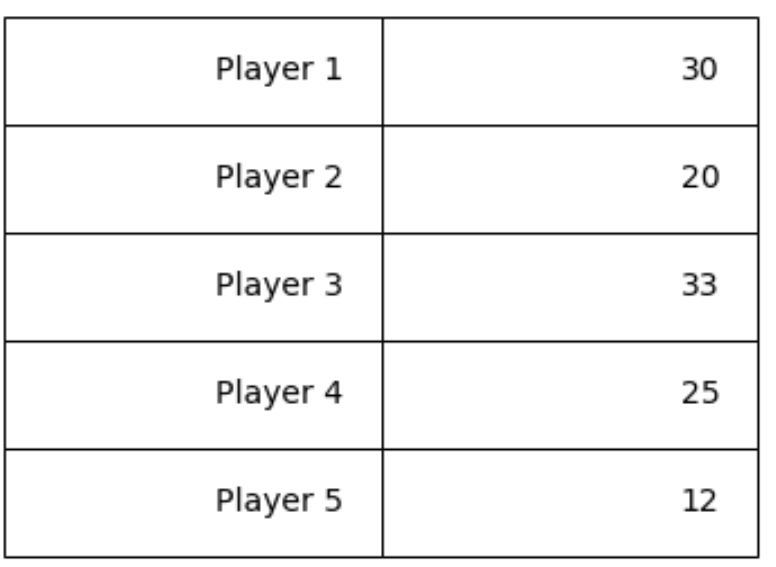
Example 2: Create Table from Custom Values
The following code shows how to create a table in Matplotlib that contains custom values:
import numpy as np
import pandas as pd
import matplotlib.pyplot as plt

#define figure and axes
fig, ax = plt.subplots()

#create values for table
table_data=[
    ["Player 1", 30],
    ["Player 2", 20],
    ["Player 3", 33],
    ["Player 4", 25],
    ["Player 5", 12]
]

#create table
table = ax.table(cellText=table_data, loc='center')

#modify table
table.set_fontsize(14)
table.scale(1,4)
ax.axis('off')

#display table
plt.show()

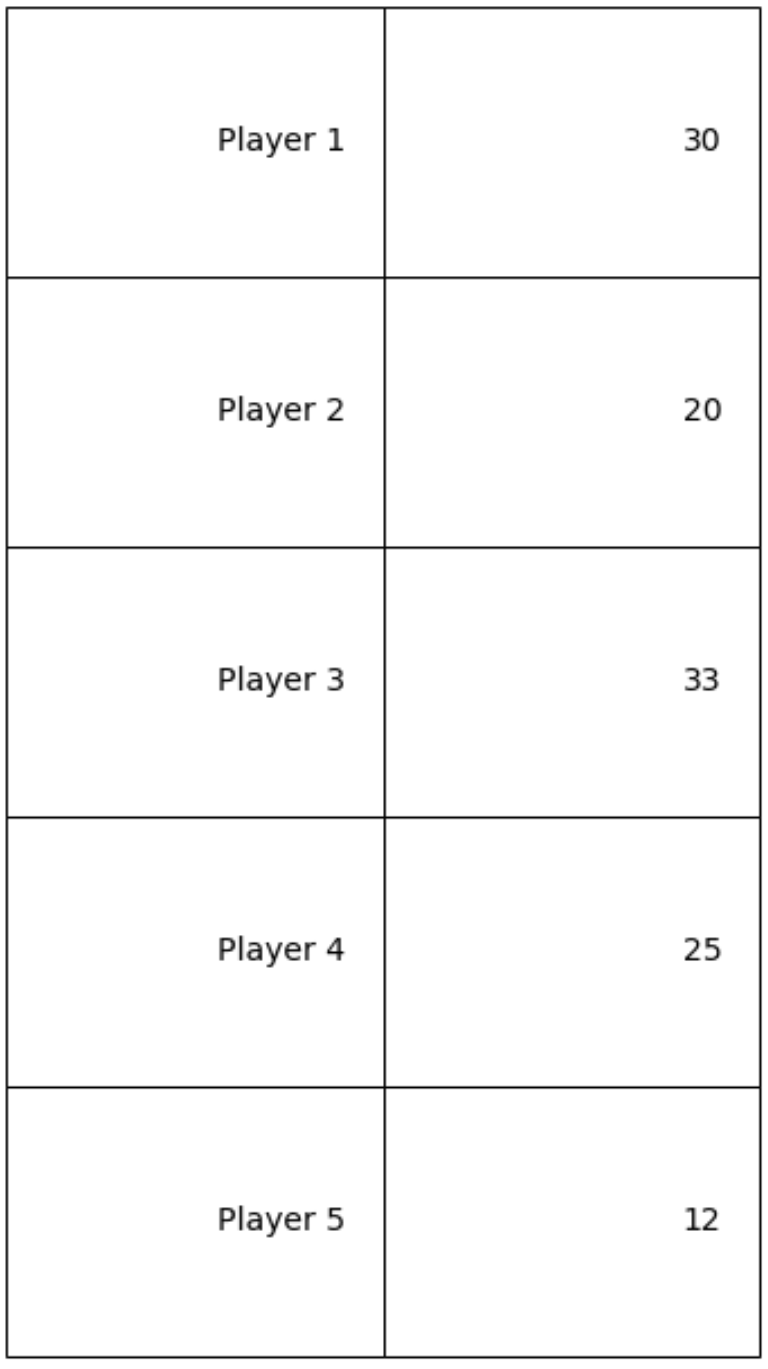
Note that the table.scale(width, length) modifies the width and length of the table. For example, we could make the table even longer by modifying the length:
table.scale(1,10)

Additional Resources
How to Add Text to Matplotlib Plots
How to Set the Aspect Ratio in Matplotlib
How to Change Legend Font Size in Matplotlib
