The mode of a frequency table represents the value that occurs most often.
In practice, there can be:
- Zero modes if no value occurs more often than any other.
- One mode if one value occurs most often.
- Multiple modes if several values occur most often.
To identify the mode of a frequency table, you simply need to identify the value(s) with the highest frequency.
The following examples show how to find the mode of different frequency tables.
Example 1: Find Mode from Frequency Table (Zero Modes)
The following frequency table shows the number of pets owned by 10 different families in a certain neighborhood:

Notice that each value in the table has the same frequency.
This means there is no mode for this particular frequency table since each value occurs the same number of times.
Example 2: Find Mode from Frequency Table (One Mode)
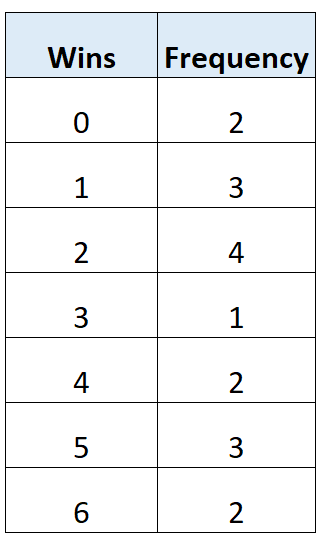
The following frequency table shows the total number of wins for 17 soccer teams in a certain league:

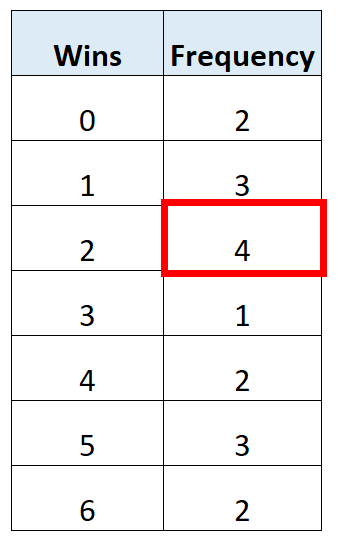
The number of wins with the highest frequency is 2 wins.

Thus, the mode for this frequency table is 2.
Example 3: Find Mode from Frequency Table (Multiple Modes)
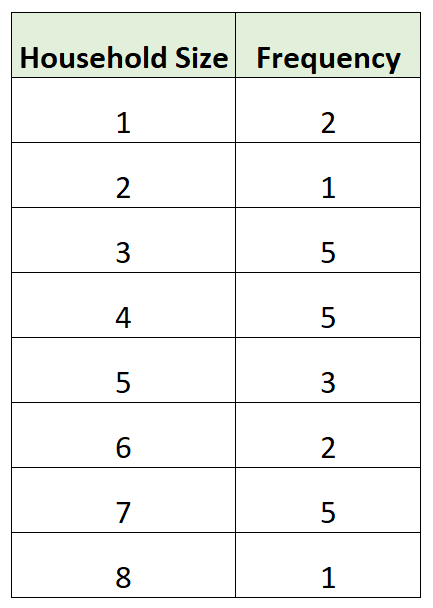
The following frequency table shows the household size of different households in a particular area:

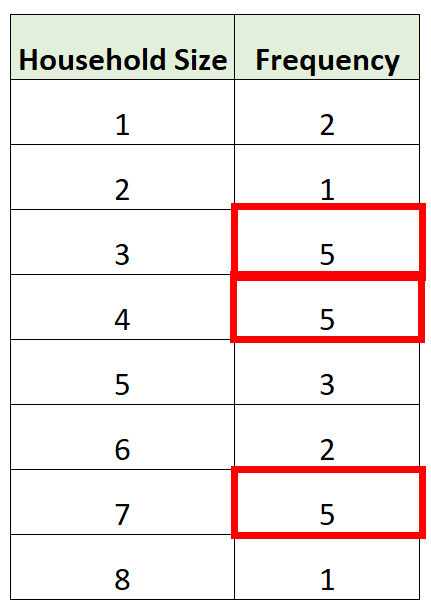
The household sizes with the highest frequency are 3, 4, and 7.

Thus, this frequency table actually has three modes: 3, 4, and 7.
Additional Resources
How to Calculate Median from Frequency Table
How to Calculate Mean from Frequency Table
