260
You can use the following syntax to plot multiple histograms on the same chart in base R:
hist(data1, col='red')
hist(data2, col='blue', add=TRUE)
And you can use the following syntax to plot multiple histograms in ggplot2:
ggplot(df, aes(x = x_var, fill = grouping_var)) +
  geom_histogram(position = 'identity', alpha = 0.4)
The following examples show how to use each of these methods in practice.
Method 1: Plot Multiple Histograms in Base R
The following code shows how to plot multiple histograms in one plot in base R:
#make this example reproducible
set.seed(1)

#define data
x1 = rnorm(1000, mean=0.8, sd=0.2)
x2 = rnorm(1000, mean=0.4, sd=0.1)

#plot two histograms in same graph
hist(x1, col='red', xlim=c(0, 1.5), main='Multiple Histograms', xlab='x')
hist(x2, col='green', add=TRUE)

#add legend
legend('topright', c('x1 variable', 'x2 variable'), fill=c('red', 'green')) 
Method 2: Plot Multiple Histograms in ggplot2
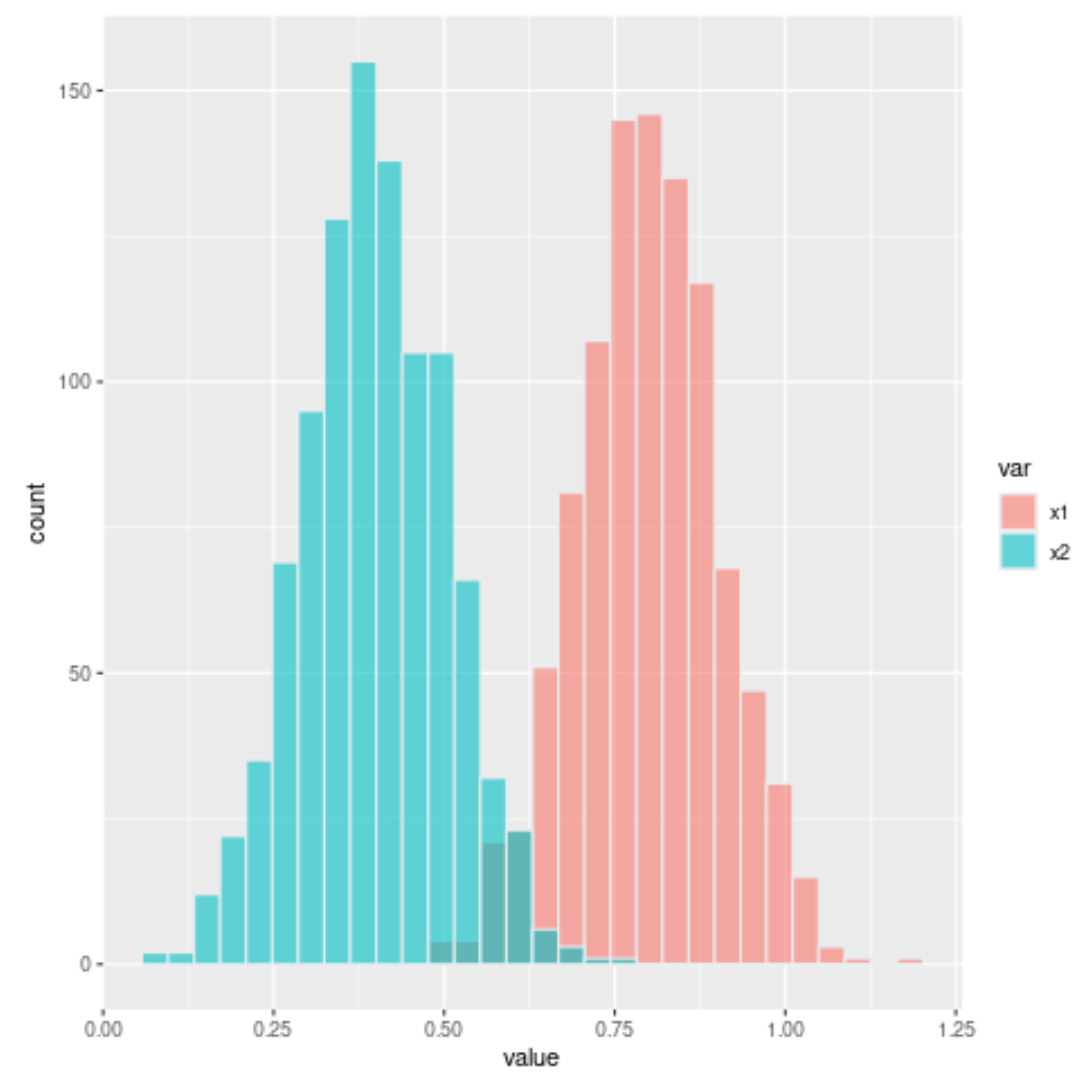
The following code shows how to plot multiple histograms in one plot in R using ggplot2:
library(ggplot2)

#make this example reproducible
set.seed(1)

#create data frame
df frame(var = c(rep('x1', 1000), rep('x2', 1000) ),
                   value = c(rnorm(1000, mean=0.8, sd=0.1),
                             rnorm(1000, mean=0.4, sd=0.1)))

#view first six rows of data frame
head(df)

  var     value
1  x1 0.7373546
2  x1 0.8183643
3  x1 0.7164371
4  x1 0.9595281
5  x1 0.8329508
6  x1 0.7179532

#plot multiple histograms
ggplot(df, aes(x=value, fill=var)) +
  geom_histogram( color='#e9ecef', alpha=0.6, position='identity')
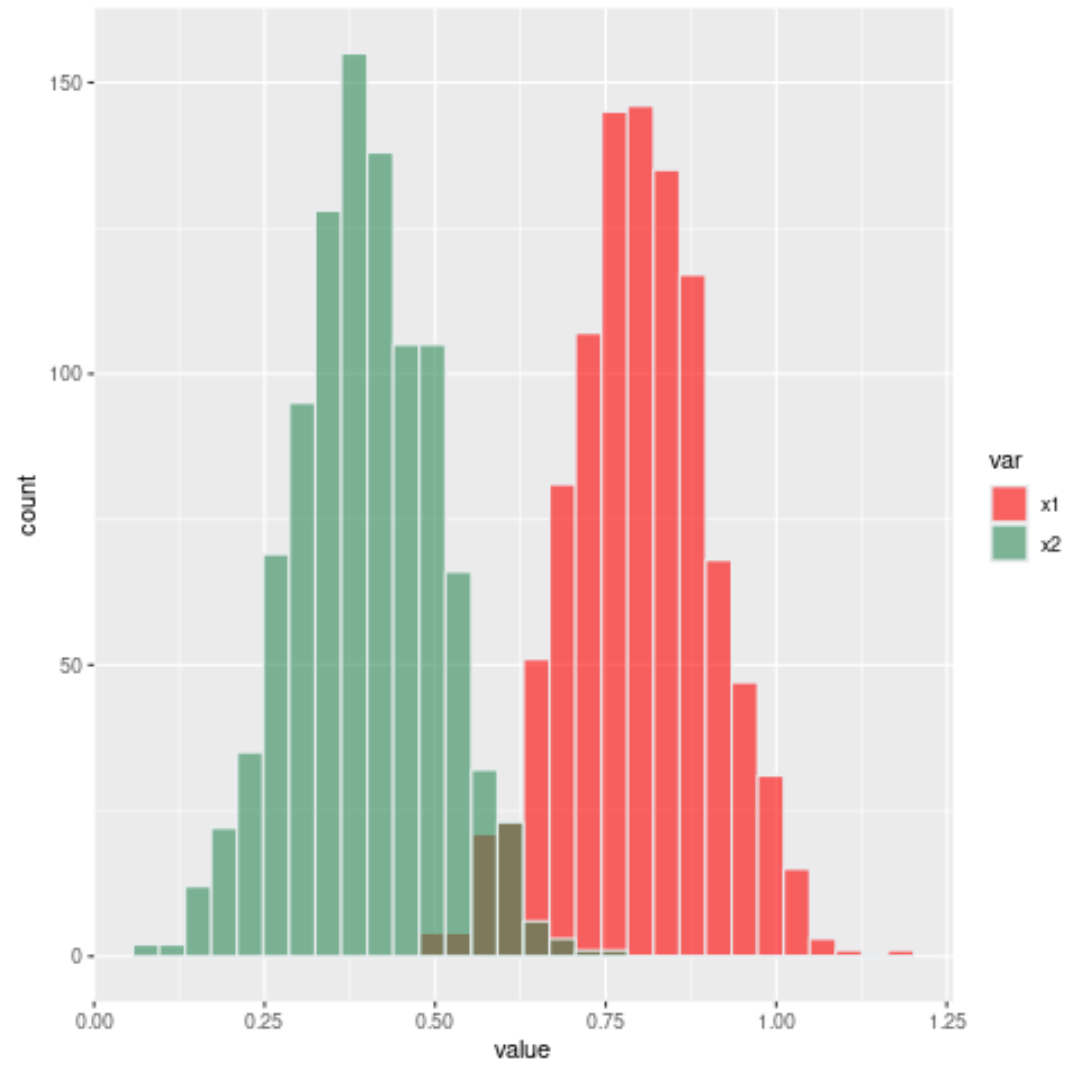
You can quickly change the colors of the histograms by using the scale_fill_manual() function:
Additional Resources
The following tutorials explain how to create other common charts in R:
How to Create a Relative Frequency Histogram in R
How to Plot Multiple Boxplots in One Chart in R
How to Plot Multiple Lines in One Chart in R