One warning you may encounter when using matplotlib is:
No handles with labels found to put in legend.
This warning usually occurs for one of two reasons:
1. You failed to create labels for the data in the plot.
2. You attempted to create a legend before creating a plot.
The following examples shows how to avoid this warning in both scenarios.
Example 1: You failed to create labels for the data in the plot.
Suppose we attempt to use the following code to create a line chart in matplotlib with a legend and labels:
import matplotlib.pyplot as plt
import pandas as pd

#define data values
df = pd.DataFrame({'x': [18, 22, 19, 14, 14, 11, 20, 28],
                   'y': [5, 7, 7, 9, 12, 9, 9, 4],
                   'z': [11, 8, 10, 6, 6, 5, 9, 12]})

#add multiple lines to matplotlib plot
plt.plot(df['x'], color='green')
plt.plot(df['y'], color='blue')
plt.plot(df['z'], color='purple')

#attempt to add legend to plot
plt.legend()

No handles with labels found to put in legend.

Matplotlib creates the line plot, but we receive the warning of No handles with labels found to put in legend.
To avoid this warning, we must use the label argument to provide a label for each line in the plot:
import matplotlib.pyplot as plt
import pandas as pd

#define data values
df = pd.DataFrame({'x': [18, 22, 19, 14, 14, 11, 20, 28],
                   'y': [5, 7, 7, 9, 12, 9, 9, 4],
                   'z': [11, 8, 10, 6, 6, 5, 9, 12]})

#add multiple lines to matplotlib plot
plt.plot(df['x'], label='x', color='green')
plt.plot(df['y'], label='y', color='blue')
plt.plot(df['z'], label='z', color='purple')

#attempt to add legend to plot
plt.legend()
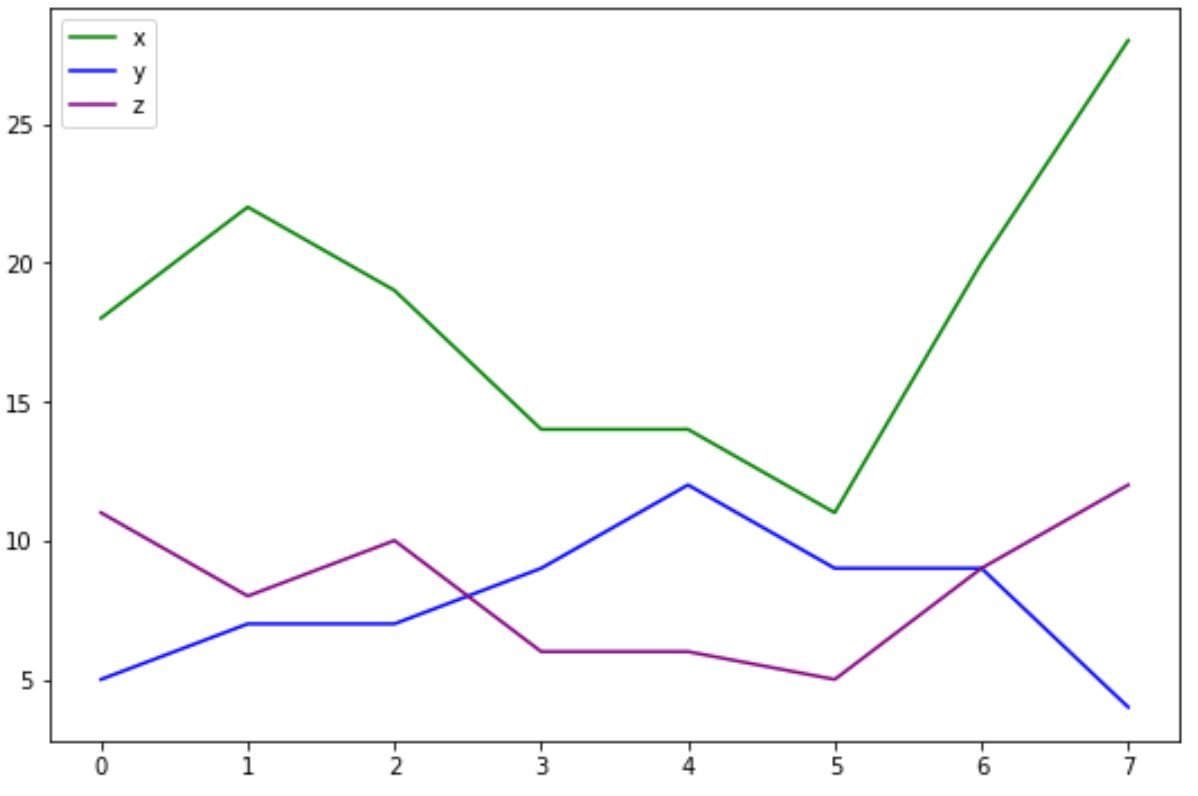
Notice that a legend is created with labels and we don’t receive any warning this time.
Example 2: You attempted to create a legend before creating a plot.
Suppose we attempt to use the following code to create a line chart in matplotlib with a legend and labels:
import matplotlib.pyplot as plt
import pandas as pd

#define data values
df = pd.DataFrame({'x': [18, 22, 19, 14, 14, 11, 20, 28],
                   'y': [5, 7, 7, 9, 12, 9, 9, 4],
                   'z': [11, 8, 10, 6, 6, 5, 9, 12]})

#attempt to add legend to plot
plt.legend()

#add multiple lines to matplotlib plot
plt.plot(df['x'], label='x', color='green')
plt.plot(df['y'], label='y', color='blue')
plt.plot(df['z'], label='z', color='purple')

No handles with labels found to put in legend.
Matplotlib creates the line plot, but we receive the warning of No handles with labels found to put in legend.
To avoid this warning, we must use plt.legend() after adding the lines to the plot:
import matplotlib.pyplot as plt
import pandas as pd

#define data values
df = pd.DataFrame({'x': [18, 22, 19, 14, 14, 11, 20, 28],
                   'y': [5, 7, 7, 9, 12, 9, 9, 4],
                   'z': [11, 8, 10, 6, 6, 5, 9, 12]})

#add multiple lines to matplotlib plot
plt.plot(df['x'], label='x', color='green')
plt.plot(df['y'], label='y', color='blue')
plt.plot(df['z'], label='z', color='purple')

#attempt to add legend to plot
plt.legend()
A legend is created with labels and we don’t receive any warning this time.
Additional Resources
The following tutorials explain how to fix other common errors in Python:
How to Fix KeyError in Pandas
How to Fix: ValueError: cannot convert float NaN to integer
How to Fix: ValueError: operands could not be broadcast together with shapes