In statistics, an observation is simply one occurrence of something you’re measuring.
For example, suppose you’re measuring the weight of a certain species of turtle. Each turtle that you collect the weight for counts as one single observation.
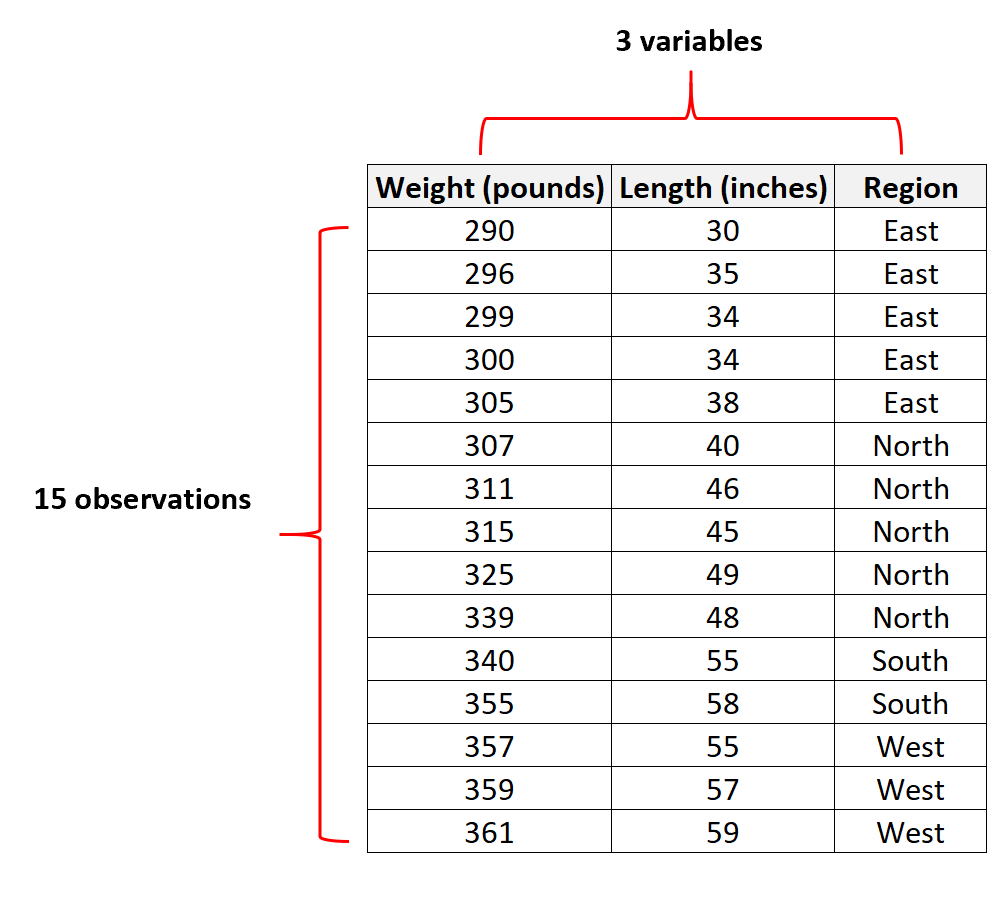
The following dataset contains the weight of 15 different turtles, so there are 15 total observations:

When viewing a dataset in statistical software like Excel, R, Python, or Stata, the number of rows in the dataset is equal to the number of observations.
For example, a dataset with 100 rows has 100 observations.
It’s also interesting to note that a single observation can be associated with multiple variables. For example, in the following dataset there are 15 observations and 3 variables:

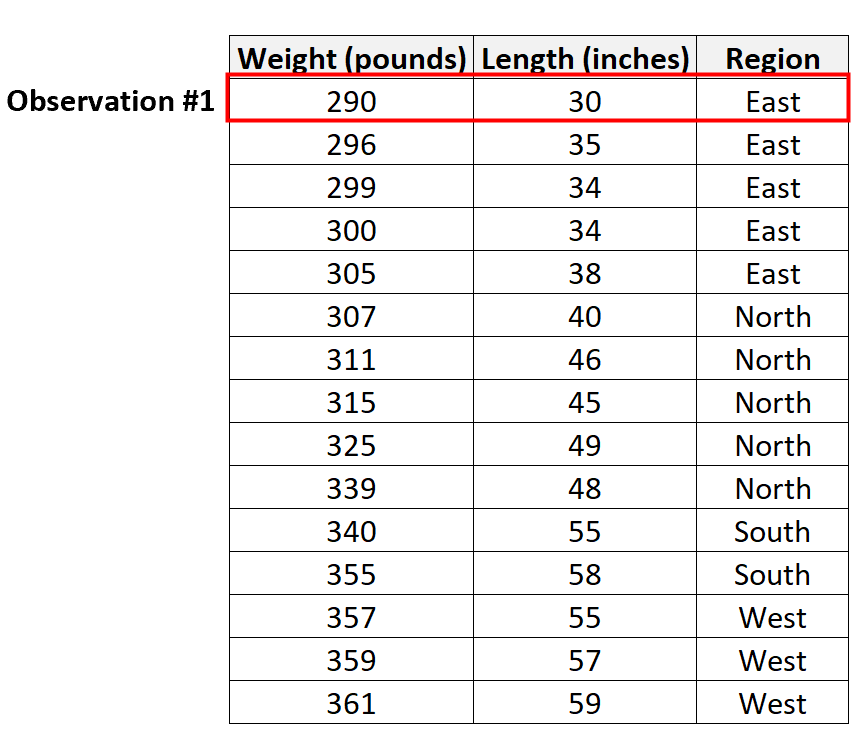
The first observation has the following values for the three variables:
- Weight: 290 pounds, Length: 30 inches, Region: East

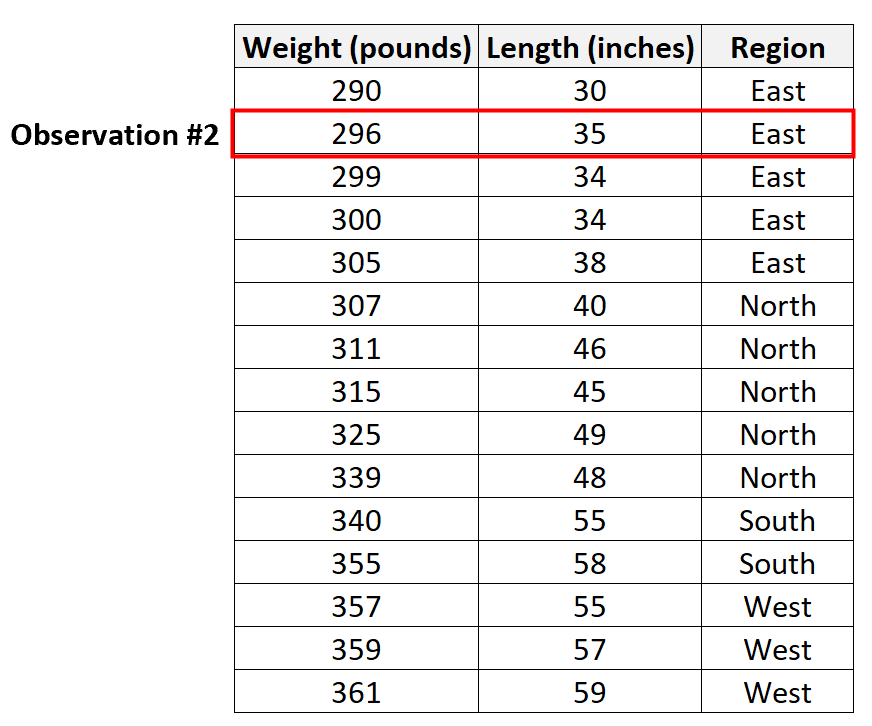
The second observation has the following values for the three variables:
- Weight: 296 pounds, Length: 35 inches, Region: East

And so on.
It’s also worth noting that the total number of observations is equal to the sample size of the dataset. For example, a dataset that has 100 observations has a sample size of 100.
Additional Resources
Descriptive vs. Inferential Statistics: What’s the Difference?
Population vs. Sample: What’s the Difference?
Statistic vs. Parameter: What’s the Difference?
