A one-way ANOVA is used to determine whether or not there is a statistically significant difference between the means of three or more independent groups.
This tutorial provides a step-by-step example of how to perform a one-way ANOVA in SAS.
Step 1: Create the Data
Suppose a researcher recruits 30 students to participate in a study. The students are randomly assigned to use one of three studying methods to prepare for an exam.
The exam results for each student are shown below:

We can use the following code to create this dataset in SAS:
/*create dataset*/
data my_data;
    input Method $ Score;
    datalines;
A 78
A 81
A 82
A 82
A 85
A 88
A 88
A 90
B 81
B 83
B 83
B 85
B 86
B 88
B 90
B 91
C 84
C 88
C 88
C 89
C 90
C 93
C 95
C 98
;
run;
Step 2: Perform the One-Way ANOVA
Next, we’ll use proc ANOVA to perform the one-way ANOVA:
/*perform one-way ANOVA*/
proc ANOVA data=my_data;
class Method;
model Score = Method;
means Method / tukey cldiff;
run; Note: We used the means function to specify that a Tukey post-hoc test should be performed if the overall p-value of the one-way ANOVA is statistically significant.
Step 3: Interpret the Results
The first table we want to analyze in the results is the ANOVA table:
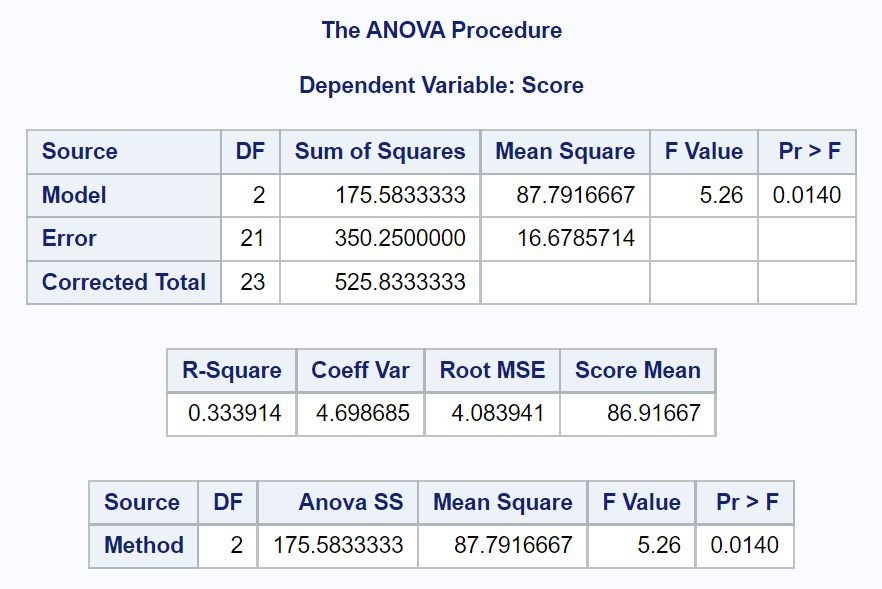
From this table we can see:
- The overall F Value: 5.26
- The corresponding p-value: 0.0140
Recall that a one-way ANOVA uses the following null and alternative hypotheses:
- H0: All group means are equal.
- HA: At least one group mean is different from the rest.
Since the p-value from the ANOVA table (0.0140) is less than α = .05, we reject the null hypothesis.
This tells us that the mean exam score is not equal between the three studying methods.
Related: How to Interpret the F-Value and P-Value in ANOVA
SAS also provides boxplots to visualize the distribution of exam scores for each of the three studying methods:
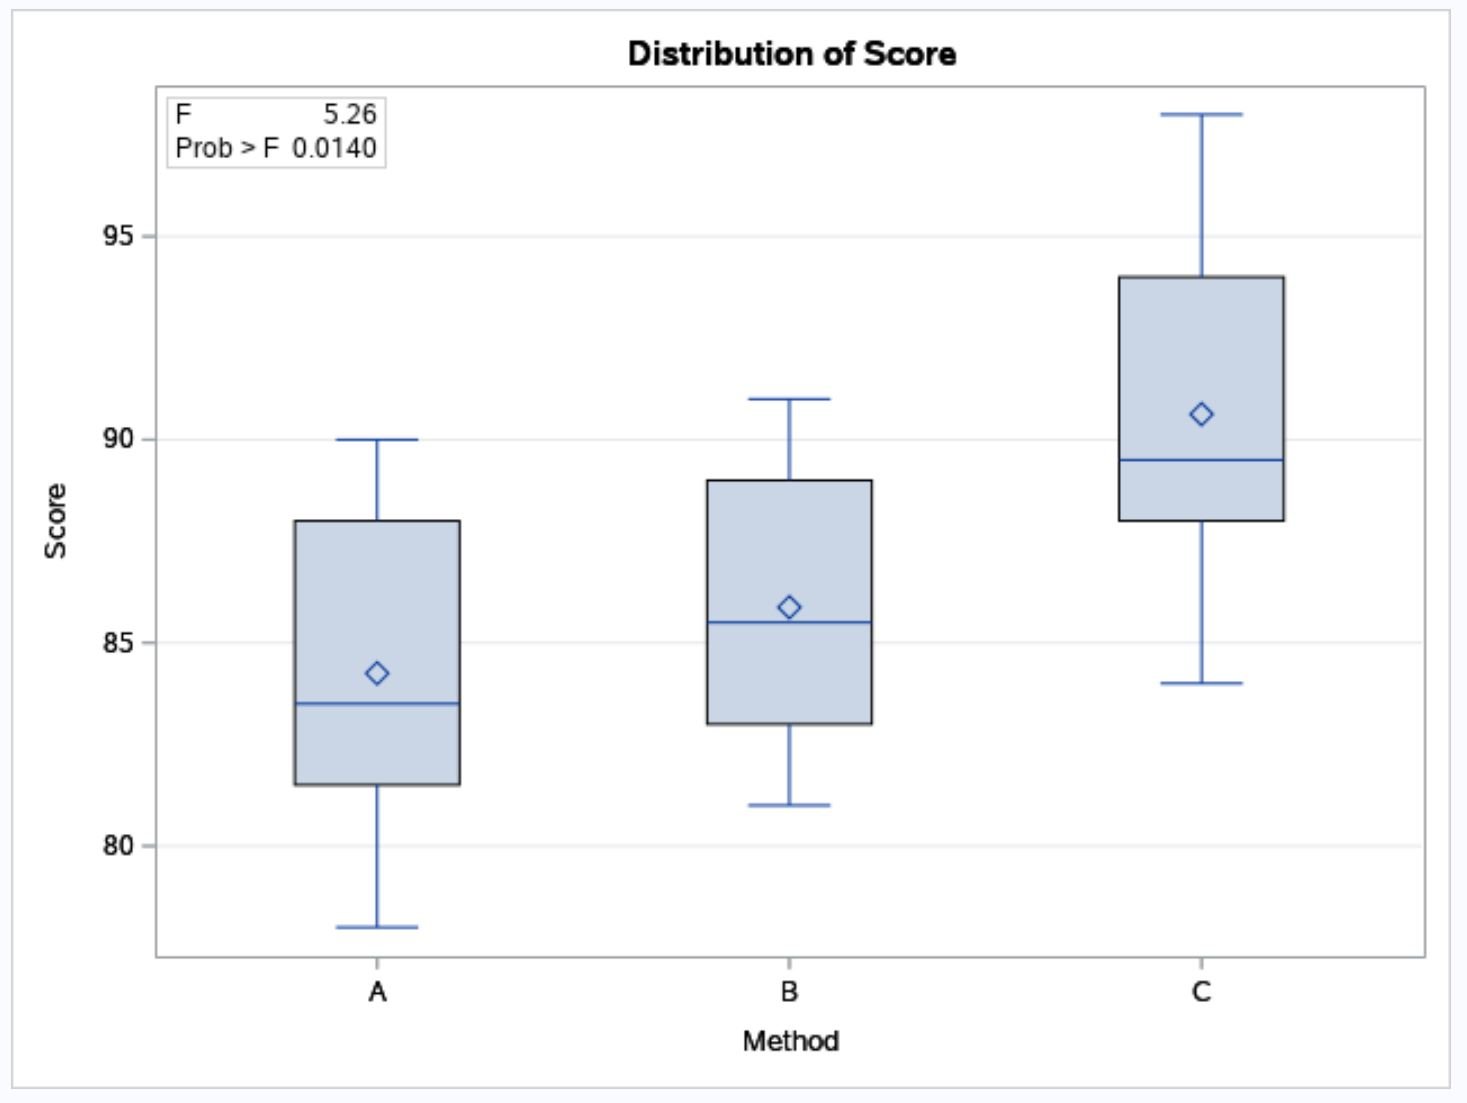
From the boxplots we can see that the exam scores tend to be higher among students who used studying method C compared to methods B and C.
To determine exactly which group means are different, we must refer to the final table in the output that shows the results of the Tukey post-hoc tests:

To tell which group means are different, we must look at which pairwise comparisons have stars (***) next to them.
From the table we can see that the mean values for groups A and C are statistically significantly different.
We can also see the 95% confidence interval for the difference in mean exam scores between group A and C:
95% Confidence Interval for Difference in Means: [1.228, 11.522]
Step 4: Report the Results
Lastly, we can report the results of the one-way ANOVA:
A one-way ANOVA was performed to compare the effect of three different studying methods on exam scores.
A one-way ANOVA revealed that there was a statistically significant difference in mean exam score between at least two groups (F(2, 21) = [5.26], p = 0.014).
Tukey’s HSD Test for multiple comparisons found that the mean value of exam score was significantly different between method C and method A (95% C.I. = [1.228,11.522]).
There was no statistically significant difference in mean exam scores between method A and method B or between method B and method C.
Additional Resources
The following tutorials provide additional information about one-way ANOVAs:
Introduction to the One-Way ANOVA
One-Way ANOVA Calculator
How to Perform a One-Way ANOVA by Hand