Often in statistics, a hypothesis test will result in a t-score test statistic. Once we find this t-score, we typically find the p-value associated with it. If this p-value is less than a certain alpha level (e.g. 0.10, 0.05, 0.01), then we reject the null hypothesis of the test and conclude that our findings are significant.
This tutorial explains how to find the p-value from a t-score in Excel using the function T.DIST, which takes the following arguments:
T.DIST(x, deg_freedom)
where:
- x: The t-score we’re interested in.
- deg_freedom: The degrees of freedom.
Let’s check out a couple examples.
Example 1: P-value from t-score (two-tailed)
A botanist wants to know if the mean height of a certain species of plant is equal to 15 inches. In a random sample of 12 plants, she finds that the sample mean height is 14.33 inches and the sample standard deviation is 1.37 inches.
Conduct a two-tailed hypothesis test using an alpha level of .05 to determine if the mean height is equal to 15 inches.
Step 1: State the hypotheses.
The null hypothesis (H0): μ = 15
The alternative hypothesis: (Ha): μ ≠ 15
Step 2: Find the t-score and degrees of freedom.
t-score = (x-μ) / (s/√n) = (14.33-15) / (1.37/√12) = -1.694.
degrees of freedom = n-1 = 12-1 = 11.
Step 3: Find the p-value of the t-score using Excel.
To find the p-value for the t-score, we will use the following formula in Excel:
=T.DIST.2T(ABS(-1.694), 11)

This tells us that the two-tailed p-value is 0.1184.
Step 4: Reject or fail to reject the null hypothesis.
Since the p-value of 0.1184 is not less than our chosen alpha level of .05, we fail to reject the null hypothesis. We do not have sufficient evidence to say that the mean height of plants is different from 15 inches.
Example 2: P-value from t-score (one-tailed)
A company wants to know whether or not a new type of battery has a a longer mean life than the current standard battery, which has a mean life of 18 hours. In a random sample of 25 of the new batteries, they find that the mean life is 19 hours with a standard deviation of 4 hours.
Conduct a one-tailed hypothesis test using an alpha level of .05 to determine if the mean life of the new battery is longer than the mean life of the current standard battery.
Step 1: State the hypotheses.
The null hypothesis (H0): μ ≤ 18
The alternative hypothesis: (Ha): μ > 18
Step 2: Find the t-score and degrees of freedom.
t-score = (x-μ) / (s/√n) = (19-18) / (4/√25) = 1.25.
degrees of freedom = n-1 = 25-1 = 24.
Step 3: Find the p-value of the t-score using Excel.
To find the p-value for the t-score, we will use the following formula in Excel:
=T.DIST.RT(1.25, 24)
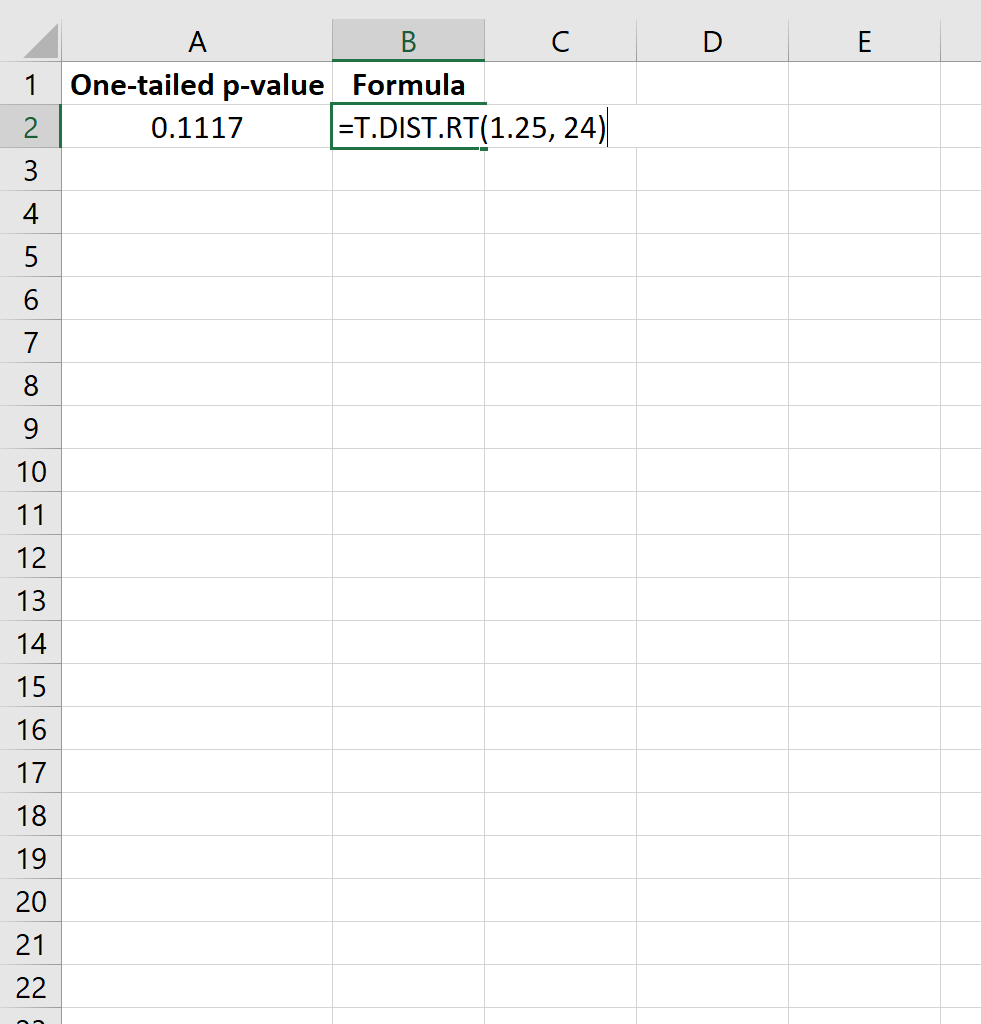
This tells us that the one-sided p-value is 0.1117.
Step 4: Reject or fail to reject the null hypothesis.
Since the p-value of 0.1117 is greater than our chosen alpha level of .05, we fail to reject the null hypothesis. We do not have sufficient evidence to say that the mean life of the new battery is longer than the mean life of the current standard battery.
For more statistics tutorials in Excel, be sure to check out our complete list of Excel Guides.