The easiest way to calculate p-values in Google Sheets is to use the T.TEST() function, which finds the p-value associated with a t-test and uses the following syntax:
T.TEST(range 1, range2, tails, type)
where:
- range1: The first sample of data
- range2: The second sample of data
- tails: The number of tails to use for the test
- 1: One-tailed (or “one-sided”) t-test
- 2: Two-tailed (or “two-sided) t-test
- type: The type of t-test
- 1: Paired t-test
- 2: Two sample t-test with equal variance
- 3: Two sample t-test with unequal variance
This function returns the p-value that corresponds with the t-test.
The following step-by-step example shows how to use this function in practice.
Step 1: Create the Data
First, let’s create a fake dataset that contains the height of two different plant species:

Step 2: Calculate the P-Value of the t-Test
Next, suppose we want to perform a t-test to determine if the mean height between the two plant species is equal.
The following screenshots show which formulas to use to calculate the p-values of the tests.
Paired Samples t-Test
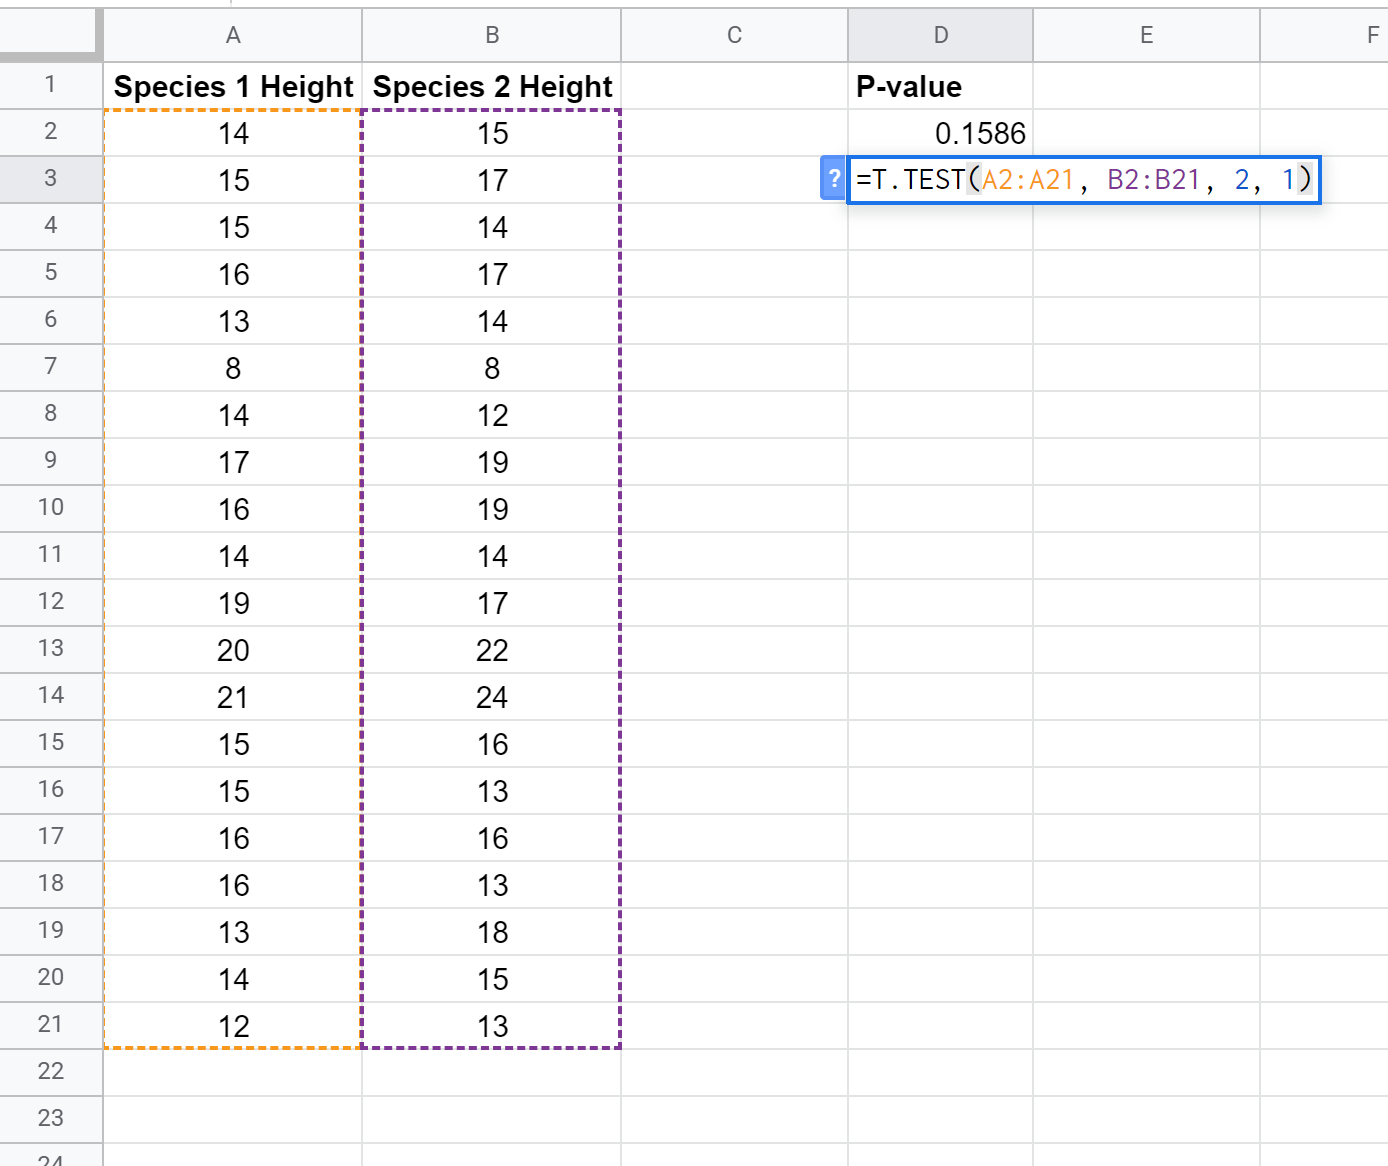
We can use the following formula to calculate the p-value for a paired samples t-test:

The p-value turns out to be 0.1586. Since this is not less than α = .05, we fail to reject the null hypothesis of the test. We do not have sufficient evidence to say that the mean height between the two species is different.
Two Sample t-Test with Equal Variance
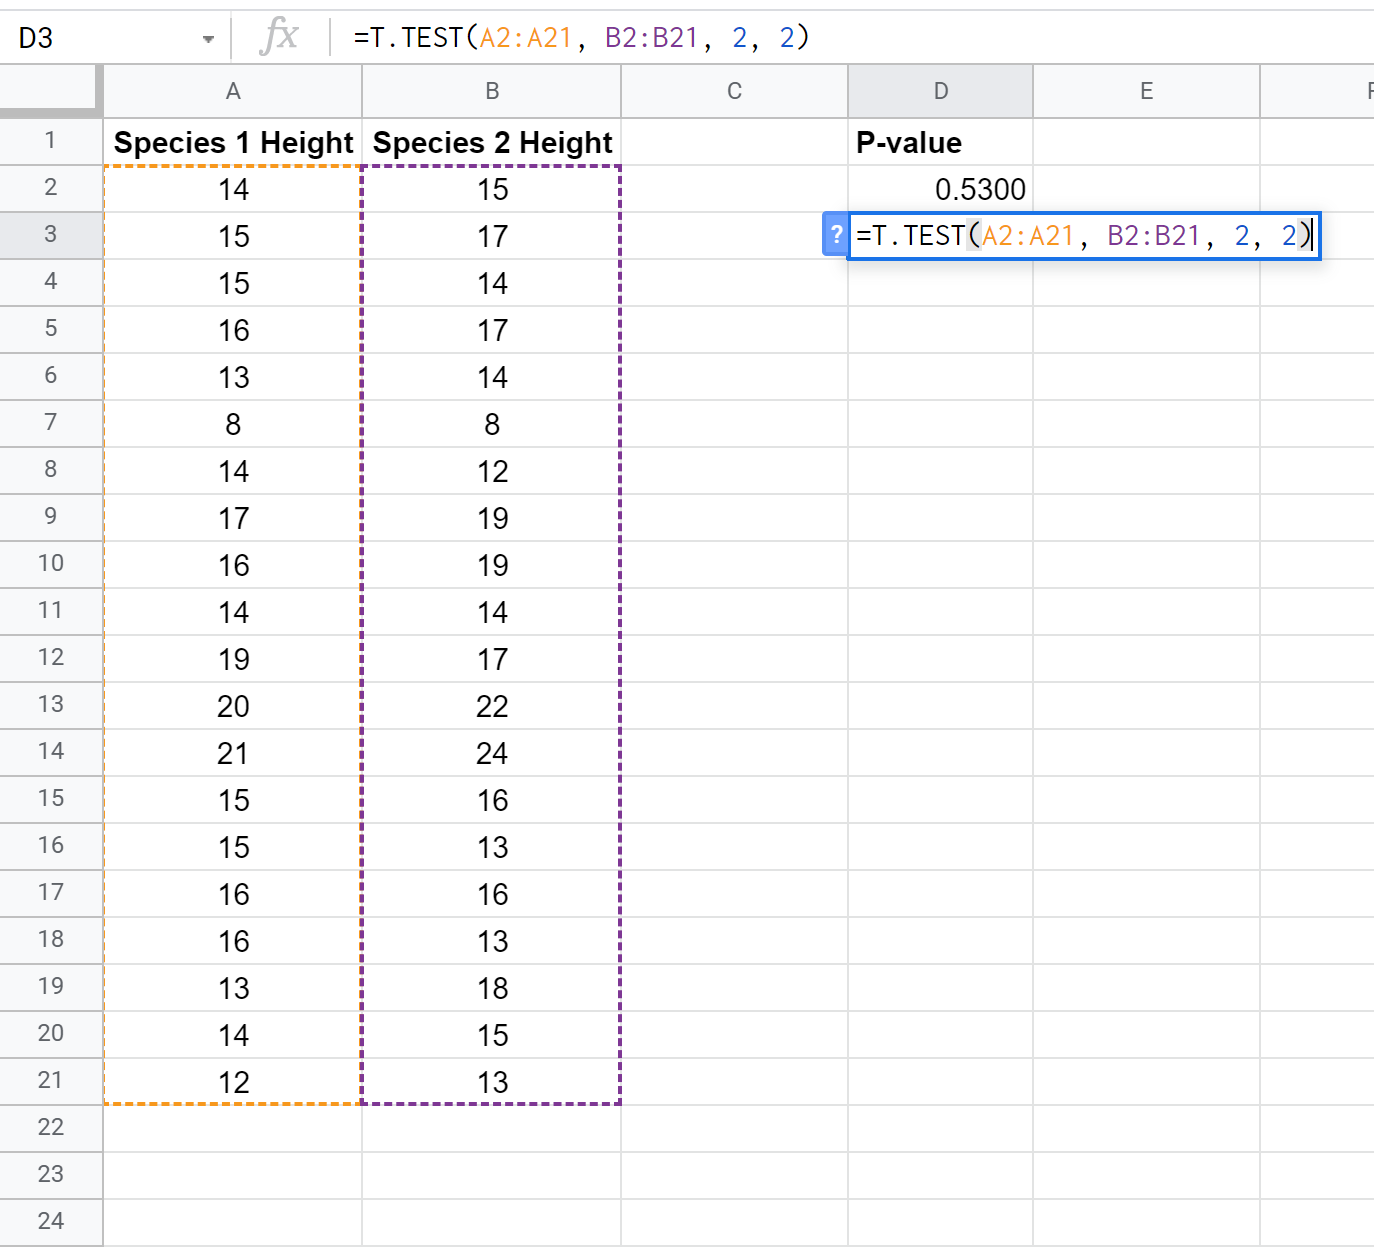
We can use the following formula to calculate the p-value for a two sample t-test with equal variance:

The p-value turns out to be 0.5300. Since this is not less than α = .05, we fail to reject the null hypothesis of the test. We do not have sufficient evidence to say that the mean height between the two species is different.
Two Sample t-Test with Unequal Variance
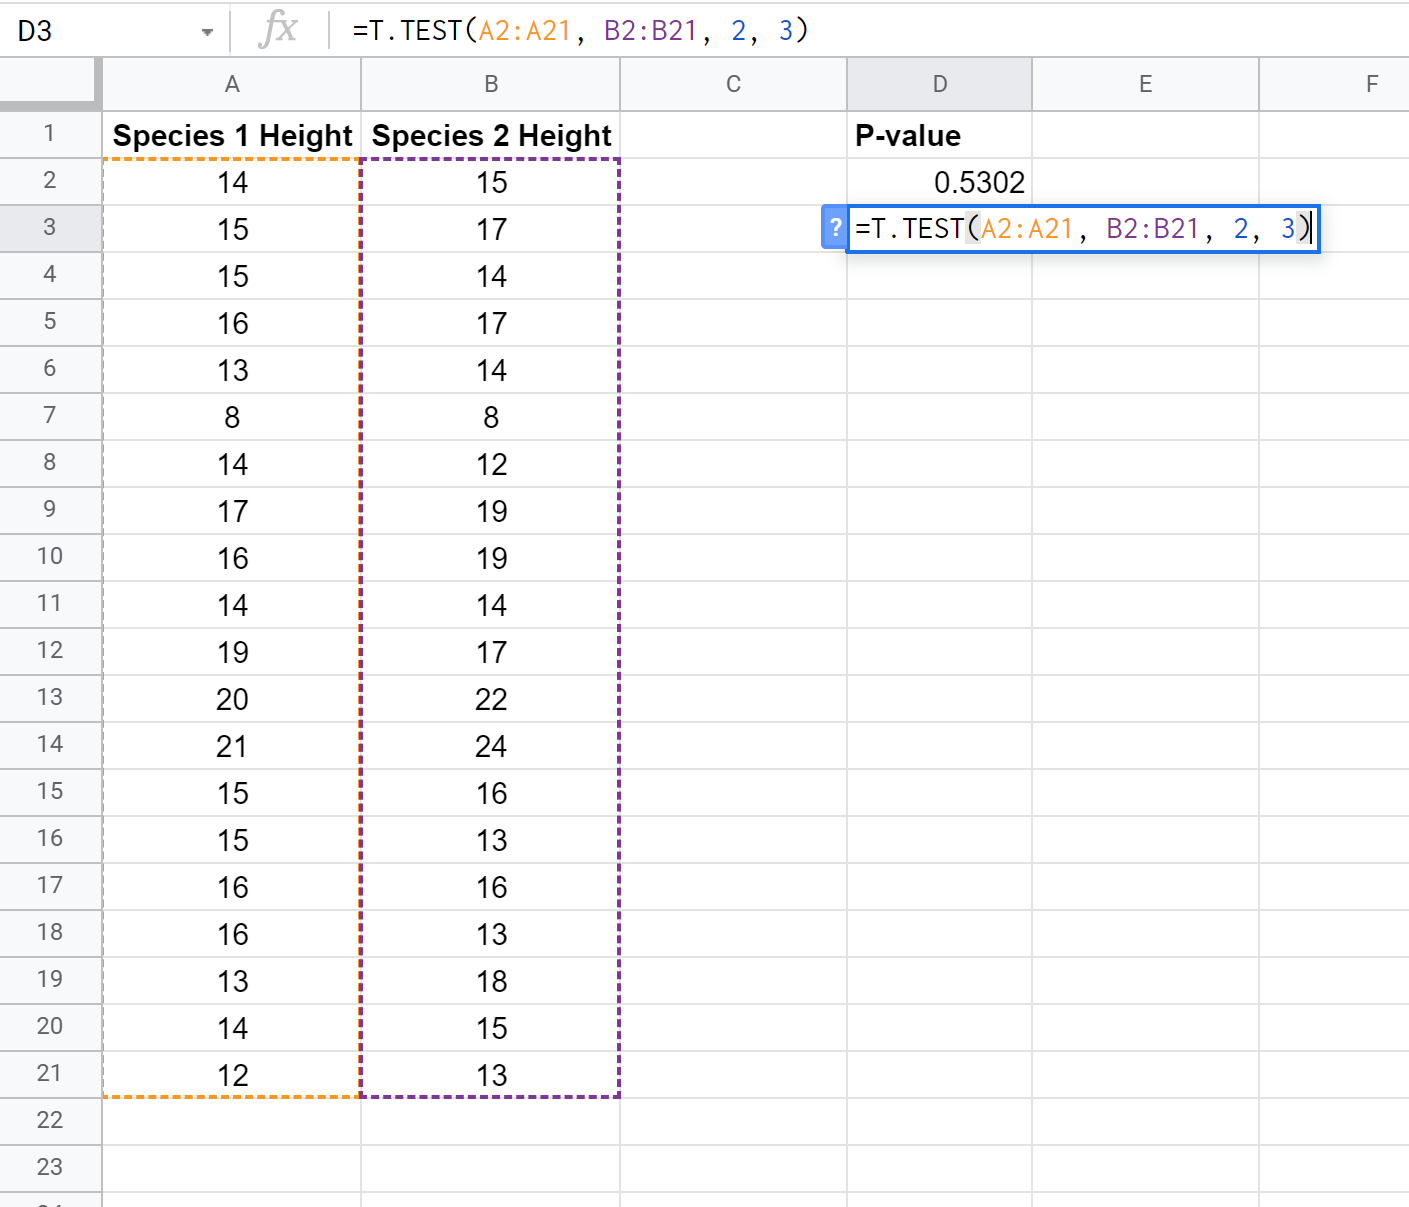
We can use the following formula to calculate the p-value for a two sample t-test with unequal variance:

The p-value turns out to be 0.5302. Since this is not less than α = .05, we fail to reject the null hypothesis of the test. We do not have sufficient evidence to say that the mean height between the two species is different.
Additional Resources
An Explanation of P-Values and Statistical Significance
How to Perform t-Tests in Google Sheets
How to Perform a One-Way ANOVA in Google Sheets
