You can use the following methods to perform a groupby and plot with a pandas DataFrame:
Method 1: Group By & Plot Multiple Lines in One Plot
#define index column
df.set_index('day', inplace=True)

#group data by product and display sales as line chart
df.groupby('product')['sales'].plot(legend=True)
Method 2: Group By & Plot Lines in Individual Subplots
pd.pivot_table(df.reset_index(),
               index='day', columns='product', values='sales'
              ).plot(subplots=True)
The following example shows how to use each method in practice with the following pandas DataFrame:
import pandas as pd

#create DataFrame
df = pd.DataFrame({'day': [1, 2, 3, 4, 5, 1, 2, 3, 4, 5],
                   'product': ['A', 'A', 'A', 'A', 'A', 'B', 'B', 'B', 'B', 'B'],
                   'sales': [4, 7, 8, 12, 15, 8, 11, 14, 19, 20]})

#view DataFrame
df

	day	product	sales
0	1	A	4
1	2	A	7
2	3	A	8
3	4	A	12
4	5	A	15
5	1	B	8
6	2	B	11
7	3	B	14
8	4	B	19
9	5	B	20
Method 1: Group By & Plot Multiple Lines in One Plot
The following code shows how to group the DataFrame by the ‘product’ variable and plot the ‘sales’ of each product in one chart:
#define index column
df.set_index('day', inplace=True)

#group data by product and display sales as line chart
df.groupby('product')['sales'].plot(legend=True)

The x-axis displays the day, the y-axis displays the sales, and each individual line displays the sales of the individual products.
Method 2: Group By & Plot Lines in Individual Subplots
The following code shows how to group the DataFrame by the ‘product’ variable and plot the ‘sales’ of each product in individual subplots:
pd.pivot_table(df.reset_index(),
               index='day', columns='product', values='sales'
              ).plot(subplots=True)
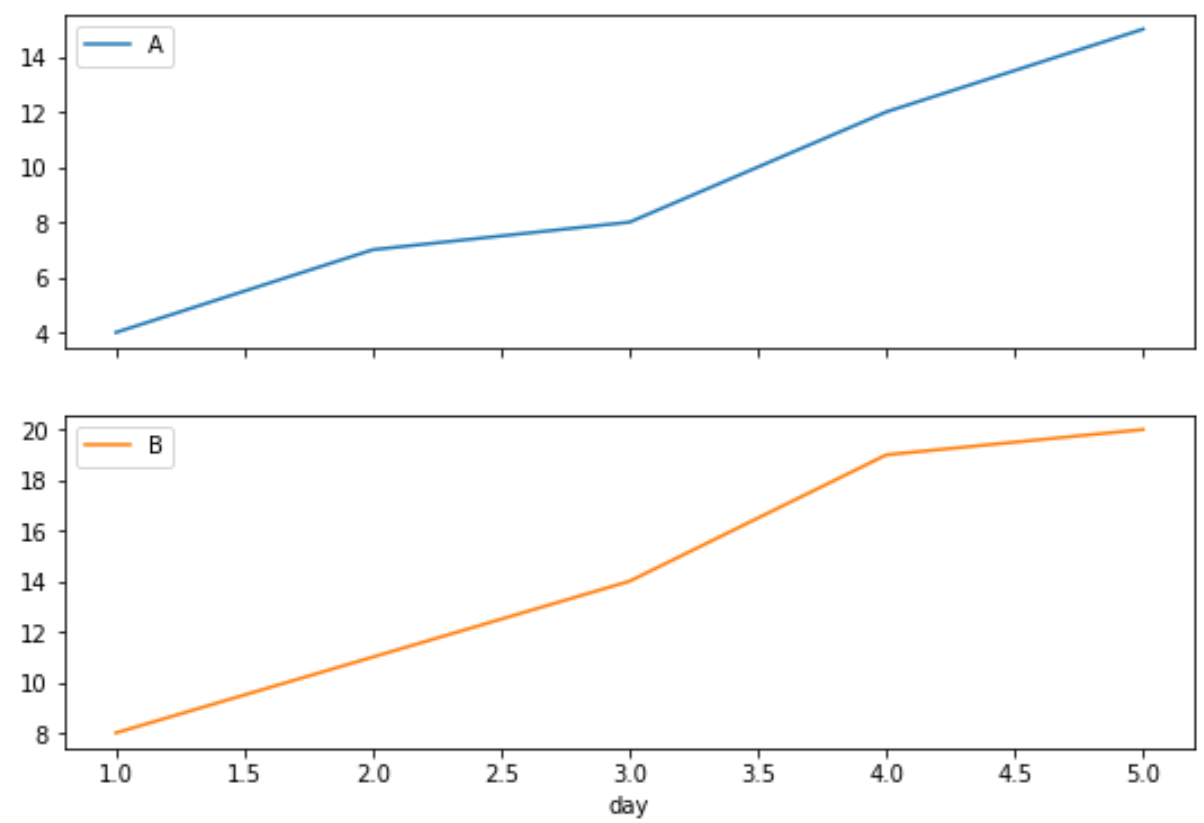
The first plot shows the sales of product A and the second plot shows the sales of product B.
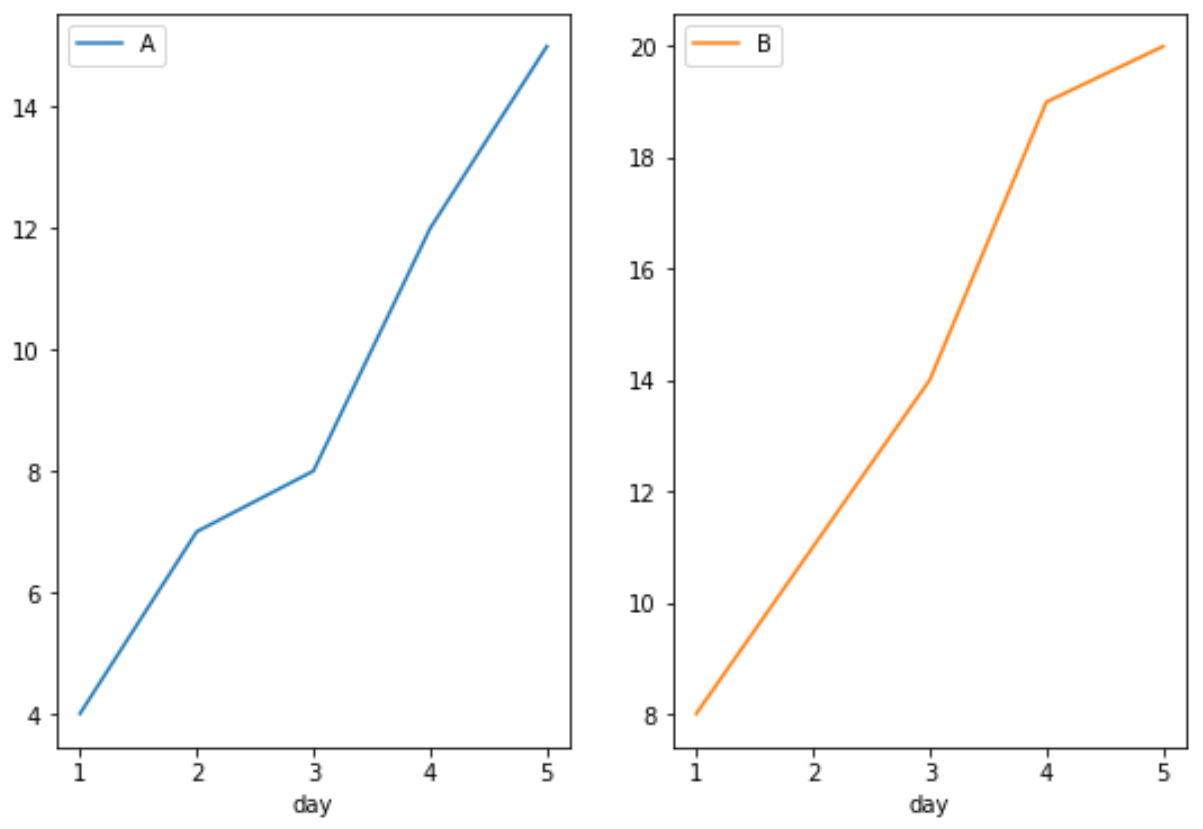
Note that we can also use the layout argument to specify the layout of the subplots.
For example, we could specify the subplots to be in a grid with one row and two columns:
pd.pivot_table(df.reset_index(),
               index='day', columns='product', values='sales'
              ).plot(subplots=True, layout=(1,2))
Additional Resources
The following tutorials explain how to create other common visualizations in pandas:
How to Create Boxplot from Pandas DataFrame
How to Create Pie Chart from Pandas DataFrame
How to Create Histogram from Pandas DataFrame