You can use the PERCENTRANK function in Excel to calculate the rank of a value in a dataset as a percentage of the total dataset.
This function uses the following basic syntax:
=PERCENTRANK(A2:A16, A2)
This particular example calculates the percentile rank of value A2 within the range A2:A16.
There are also two other percentile rank functions in Excel:
- PERCENTRANK.INC: Calculates the percentile rank of a value, including the smallest and largest values.
- PERCENTRANK.EXC: Calculates the percentile rank of a value, excluding the smallest and largest values.
The following examples show how to use these functions in practice.
Example: Calculate Percentile Rank in Excel
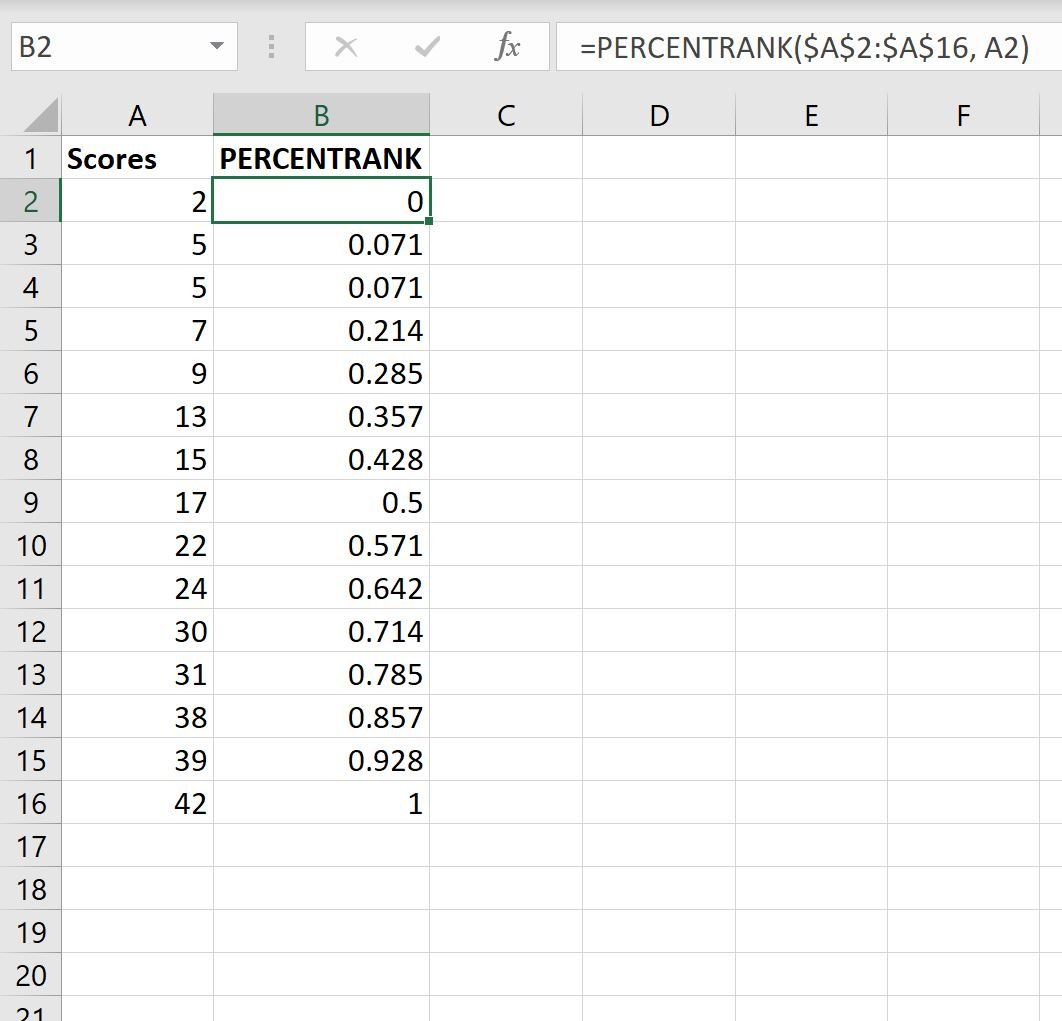
Suppose we have the following dataset that shows the exam scores received by 15 students in a certain class:

Now suppose we would like to calculate the percentile rank of each student’s score.
We can type the following formula into cell B2:
=PERCENTRANK($A$2:$A$16, A2)
We can then copy and paste this formula down to every remaining cell in column B:

Here’s how to interpret each of the percentile rank values:
- The student who scored a 2 ranked at percentile 0 (or 0%) in the class.
- The students who scored a 5 ranked at percentile .071 (or 7.1%) in the class.
- The student who scored a 7 ranked at percentile .214 (or 21.4%) in the class.
And so on.
Note that when we use the PERCENTRANK function, the smallest value in the dataset will always have a percentile rank of 0 and the largest value in the dataset will always have a percentile rank of 1.
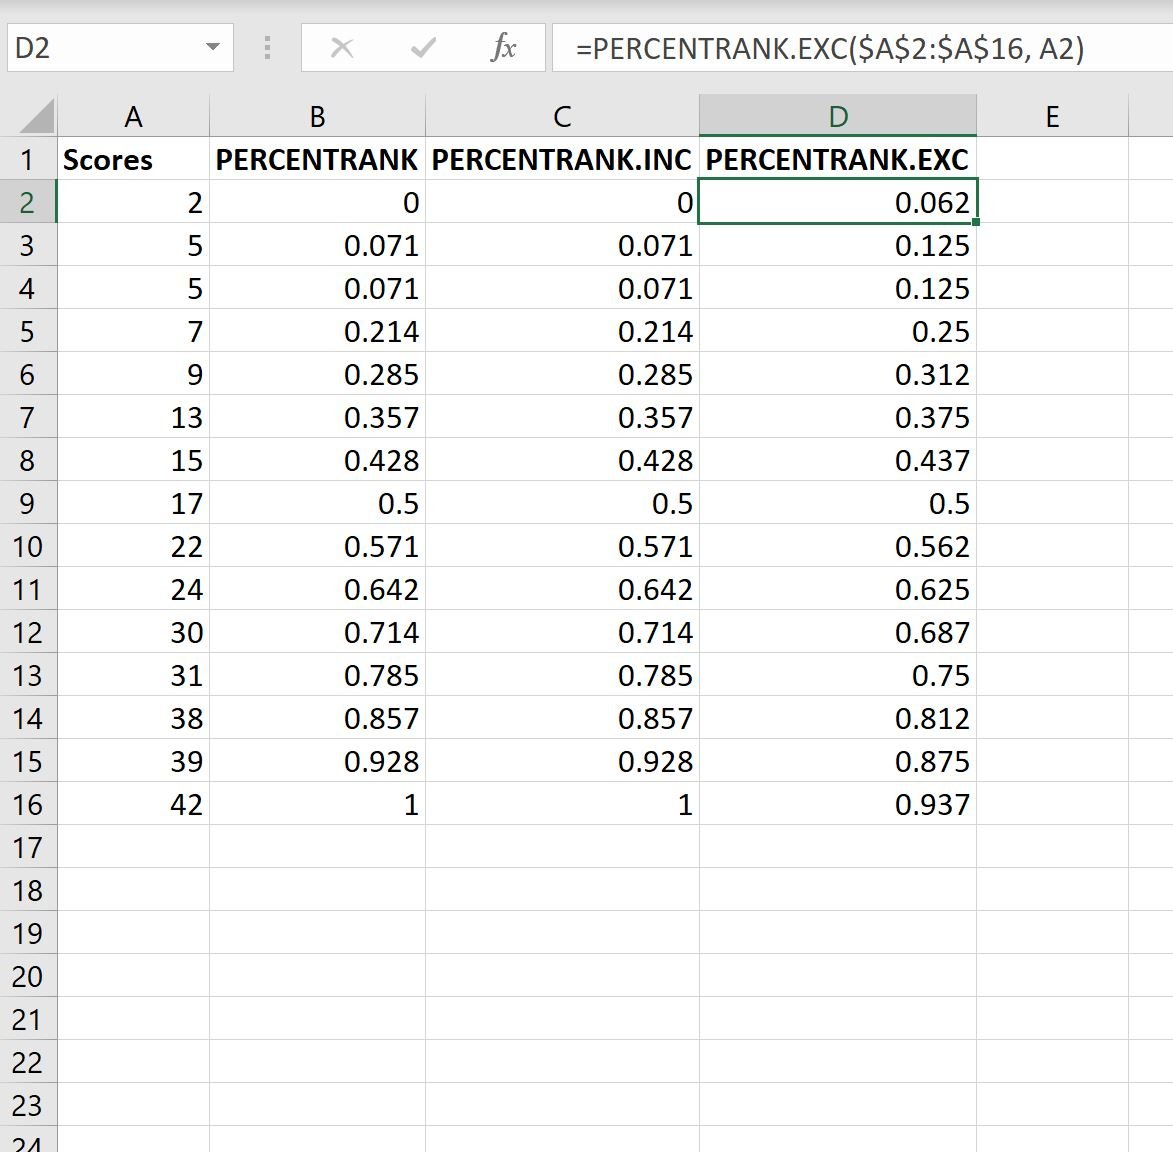
The following screenshot also shows how to use the PERCENTRANK.INC and PERCENTRANK.EXC functions:

There are two things to notice here:
1. The PERCENTILE.INC function returns the exact same values as the PERCENTRANK function.
2. The PERCENTILE.EXC function does not return a value of 0 and 1 for the smallest and largest values in the dataset, respectively.
You can find the complete documentation for the PERCENTRANK function in Excel here.
Additional Resources
The following tutorials explain how to perform other common tasks in Excel:
How to Convert Between Z-Scores and Percentiles in Excel
How to Calculate the Mean and Standard Deviation in Excel
How to Calculate the Interquartile Range in Excel
