84
POSITIVE AND NEGATIVE SLOPE
WHAT IS A SLOPE?
A number of absolute values that represent whether a line is steeper or flatter and the direction of the line on the graph are known as a slope or gradient. The slope of a line is fundamental concept in economics and mathematics. It is generally denoted by the letter ‘m’. The slope can be calculated by dividing the ‘vertical change’ with the ‘horizontal change’ between two distinct points on a line.
TYPES OF SLOPE
There are two main types of slopes which are given below:
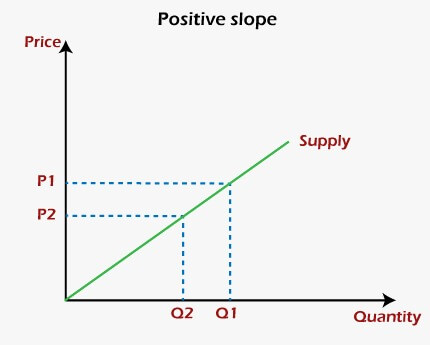
- Positive Slope: A slope in which two variables, i.e., variable at x-axis and variable at the y-axis, shows a positive relationship is known as positive slope. In simpler words, a positive slope is one in which the variable x increases with the increase in variable y and/or variable y increases with the increase in variable x. Similarly, the variable x decreases with the decrease in variable y, and/or variable y decreases with the decrease in variable x. It means both the variables are complements to each other. A positive slope moves in the upward direction or is upward sloping.
In graphical terms, a positive slope is one in which the line on the graph rises when it moves from left to right. The concept of positive slope can be clearly understood with the help of the supply curve of a producer or firm in economics. The two variables of the curve are price at the y-axis and quantity of goods at the x-axis. Let us assume the firm is producing the goods for profit maximization. Therefore, when the prices of the goods increase, the quantity supplied by the firm of those goods will also increase, while when the prices decrease, the quantity supplied by the firm will decrease. In other words, at higher prices, the firm or producer will increase the quantity supplied to earn more profit, while at lower prices, they will reduce the quantity supplied to reduce the loss. Hence, it shows the prices and quantity supplied are positively related to each other, which can be cleared from the diagram given below:

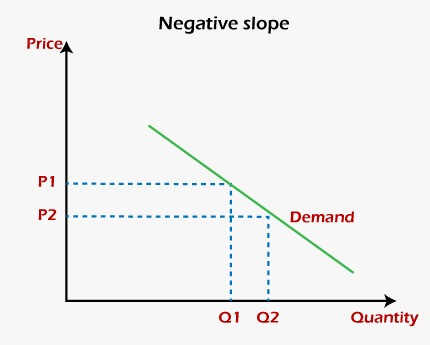
- Negative Slope: A slope in which two variables, i.e., variable at x-axis and variable at the y-axis, shows a negative relationship is known as negative slope. In other words, a negative slope is one in which the variable x increases with the decrease in variable y and/or variable y increases with the decrease in variable x. In the same manner, the variable x decreases with the increase in variable y, and/or variable y decreases with the increase in variable x. This represents an inverse relationship between these two variables. A negative slope moves in the downward direction or is downward sloping.
Graphically, a negative slope is one in which the line on the graph falls when it moves from left to right. One of the best examples of the negative slope of the graph is the demand curve in economics. The two variables of the curve are price at the y-axis and quantity of goods at the x-axis. As we know, the consumers buy a large quantity of a good at a lower price than at a higher price. Therefore, the quantity demanded by the consumers of goods will decrease with an increase in the prices of those goods. On the other hand, when prices of the goods will decrease, the quantity demand will increase. Hence, it shows a negative relationship between the prices and quantity supplied of those goods. It can be cleared from the diagram given below:

TWO OTHER TYPES OF SLOPE
Other than positive and negative slopes, there are two more types of slopes named zero slope and infinite slope. They can be understood from the given explanation:
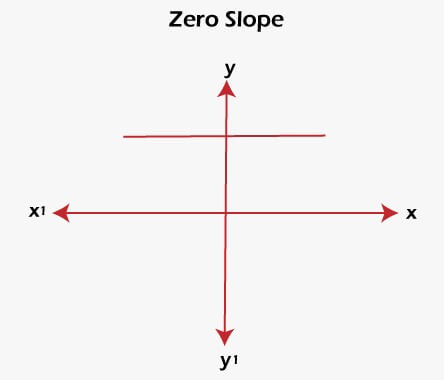
- Zero Slope: A condition in which the variable at the y-axis remains the same with the change in the variable at the x-axis is known as the slope of zero. Graphically, a horizontal or flat line on the graph has a zero Slope. Hence, it is called a constant function. A slope of zero neither moves into the upward or downward direction. It moves only to the leftward or rightward directions.
The diagram given below is a graphical presentation of the zero slope:

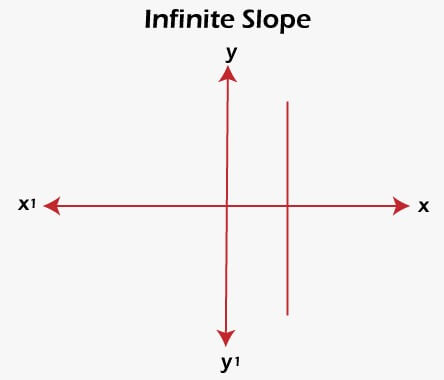
- Infinite Slope: A condition in which the variable at the x-axis remains the same with the change in the variable at the y-axis is known as the infinite slope. It is also called the undefined slope. As per the graphical terms, a vertical or perpendicular line on the graph has an infinite slope. An infinite slope neither moves to the leftward or rightward direction. It shows a movement only in the upward or downward direction.
An infinite slope is shown in the given diagram:

CALCULATION OF SLOPE
- In a linear equation of ax + by + c = 0, the slope is defined as -a/b.
- The equation of the line can be calculated with the help of the point-slope formula if both the slope m of a line and point (x1, y1) are known. The formula is given below:
y – y1 = m (x – x1) - The two-line will be parallel if their slopes are equal, while two lines will be perpendicular if the product of their slopes is -1.
ADDITIONAL INFORMATION
- The absolute value of the slope is used to find whether a curve is steeper or flatter.
- The positive and negative value of the slope decides the direction, i.e., upward or downward, of the slope.
- A curve becomes steeper with the increase in the absolute value of the slope.
- A curve becomes flattered with the decrease in the absolute value of the slope.
- These conditions are not affected by the negative or positive slope (not the negative or positive value).
- A lower positive slope implies a flatter curve that is tilted in the upward direction will be formed.
- A higher positive slope means a steeper curve that is bent in the upward direction will be formed.
- A negative slope with a large absolute value implies a steeper curve that is tilted in the downward direction will be formed.
- A negative slope having a smaller absolute value means a flatter curve that is bent in the downward direction will be formed.
Next TopicWhat is npm


