Quadratic regression is a type of regression we can use to quantify the relationship between a predictor variable and a response variable when the true relationships is quadratic, which may look like a “U” or an upside-down “U” on a graph.
That is, when the predictor variable increases the response variable tends to increase as well, but after a certain point the response variable begins to decrease as the predictor variable keeps increasing.
This tutorial explains how to perform quadratic regression in Python.
Example: Quadratic Regression in Python
Suppose we have data on the number of hours worked per week and the reported happiness level (on a scale of 0-100) for 16 different people:
import numpy as np
import scipy.stats as stats

#define variables
hours = [6, 9, 12, 12, 15, 21, 24, 24, 27, 30, 36, 39, 45, 48, 57, 60]
happ = [12, 18, 30, 42, 48, 78, 90, 96, 96, 90, 84, 78, 66, 54, 36, 24]
If we make a simple scatterplot of this data we can see that the relationship between the two variables is “U” shaped:
import matplotlib.pyplot as plt

#create scatterplot
plt.scatter(hours, happ) 
As hours worked increases, happiness also increases but once hours worked passes around 35 hours per week happiness starts to decline.
Because of this “U” shape, this means quadratic regression is likely a good candidate to quantify the relationship between the two variables.
To actually perform quadratic regression, we can fit a polynomial regression model with a degree of 2 using the numpy.polyfit() function:
import numpy as np

#polynomial fit with degree = 2
model = np.poly1d(np.polyfit(hours, happ, 2))

#add fitted polynomial line to scatterplot
polyline = np.linspace(1, 60, 50)
plt.scatter(hours, happ)
plt.plot(polyline, model(polyline))
plt.show()
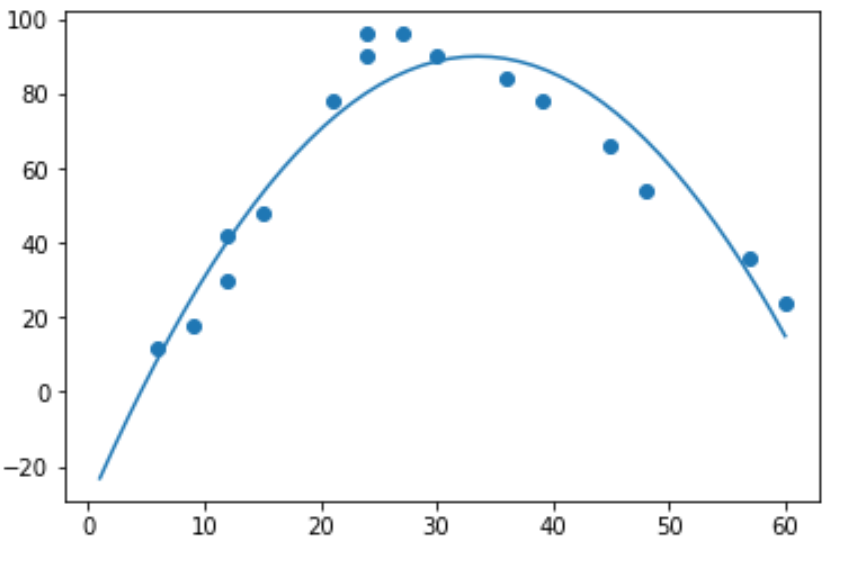
We can obtain the fitted polynomial regression equation by printing the model coefficients:
print(model)

-0.107x2 + 7.173x - 30.25
The fitted quadratic regression equation is:
Happiness = -0.107(hours)2 + 7.173(hours) – 30.25
We can use this equation to calculate the expected happiness level of an individual based on their hours worked. For example, the expected happiness level of someone who works 30 hours per week is:
Happiness = -0.107(30)2 + 7.173(30) – 30.25 = 88.64.
We can also write a short function to obtain the R-squared of the model, which is the proportion of the variance in the response variable that can be explained by the predictor variables.
#define function to calculate r-squared
def polyfit(x, y, degree):
    results = {}
    coeffs = np.polyfit(x, y, degree)
    p = np.poly1d(coeffs)
    #calculate r-squared
    yhat = p(x)
    ybar = np.sum(y)/len(y)
    ssreg = np.sum((yhat-ybar)**2)
    sstot = np.sum((y - ybar)**2)
    results['r_squared'] = ssreg / sstot

    return results

#find r-squared of polynomial model with degree = 3
polyfit(hours, happ, 2)

{'r_squared': 0.9092114182131691}
In this example, the R-squared of the model is 0.9092.
This means that 90.92% of the variation in the reported happiness levels can be explained by the predictor variables.
Additional Resources
How to Perform Polynomial Regression in Python
How to Perform Quadratic Regression in R
How to Perform Quadratic Regression in Excel