A pie chart is a type of chart that is shaped like a circle and uses “slices” to represent proportions of a whole.
Fortunately it’s easy to create a pie chart in Excel, but occasionally you may want to rotate the individual slices of the chart in a certain direction. This tutorial explains how to do so.
Example: Rotate the Slices of a Pie Chart
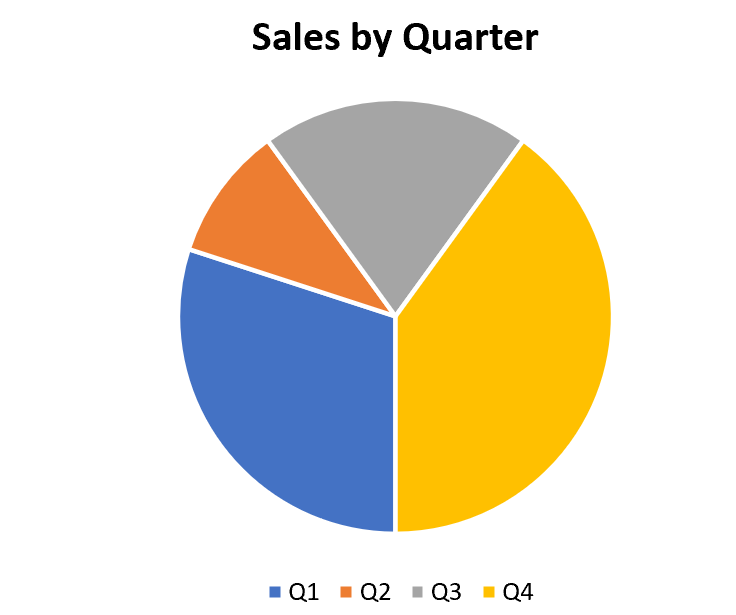
Suppose we have the following pie chart in Excel that shows the total sales by quarter for a particular company:

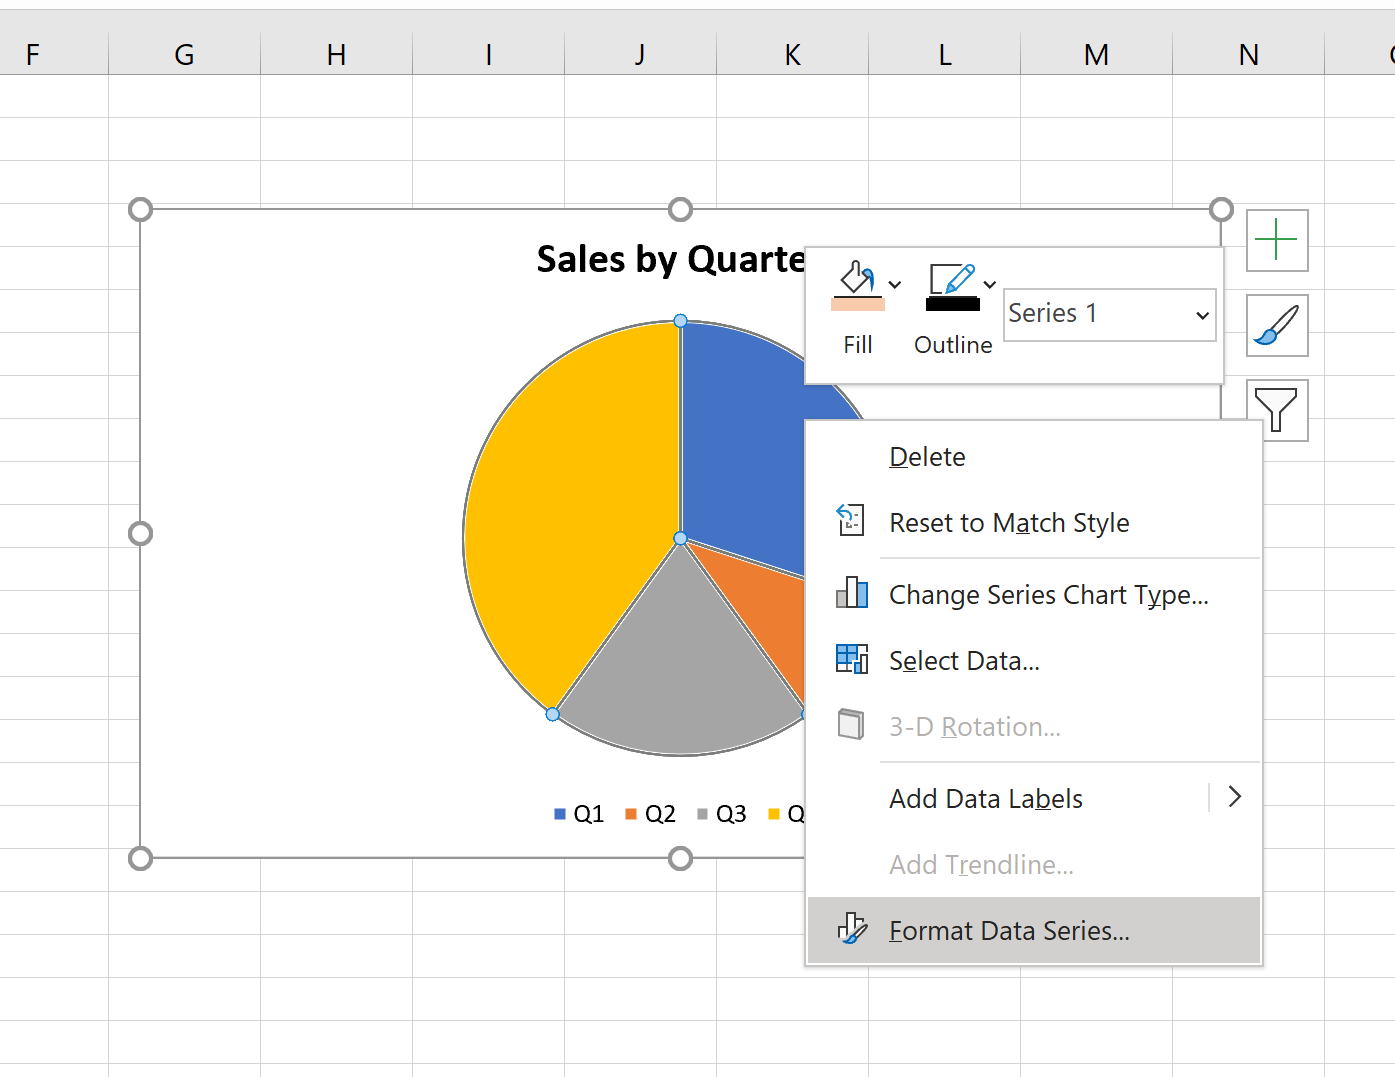
To rotate the slices in the chart, simply right click anywhere on the pie chart and then click Format Data Series…
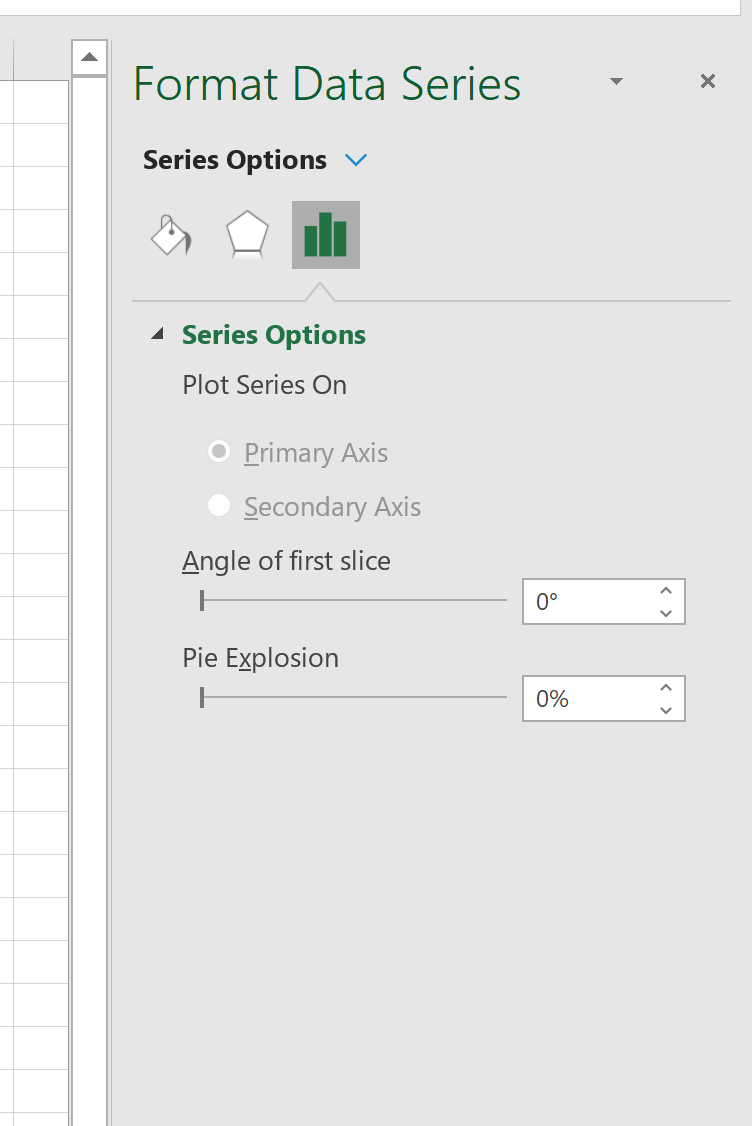
A new window will pop up on the right side of the screen with a slider bar that allows you to choose the Angle of first slice. By default, this is set to 0°.
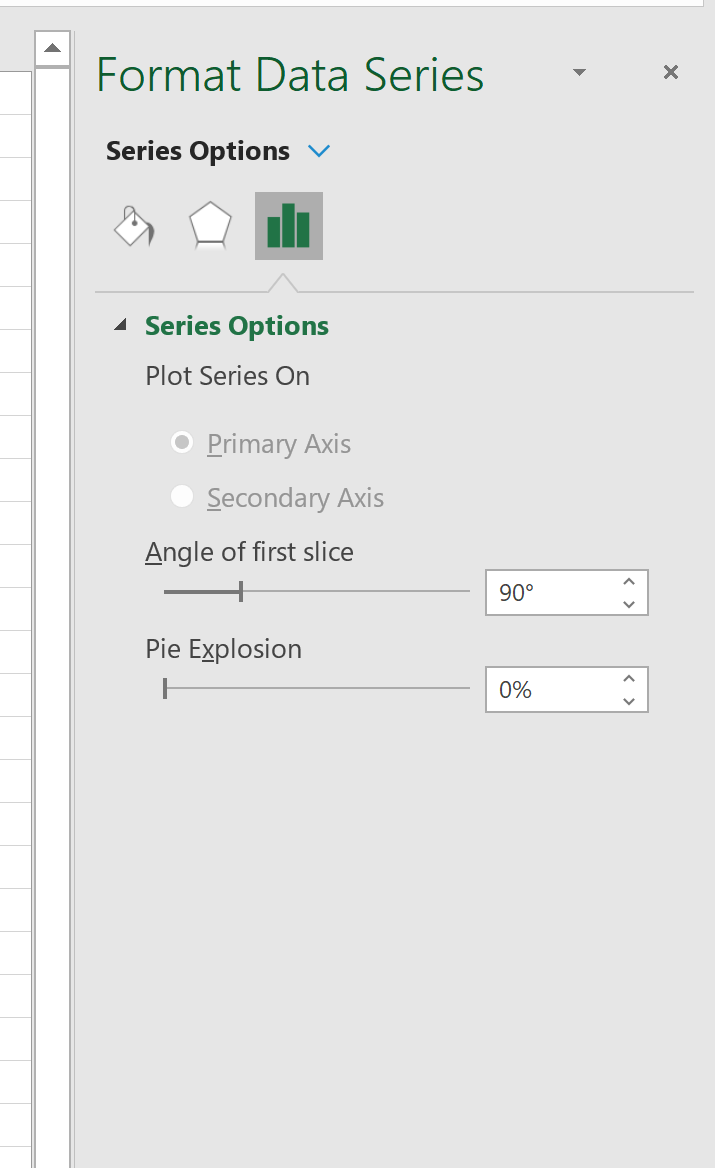
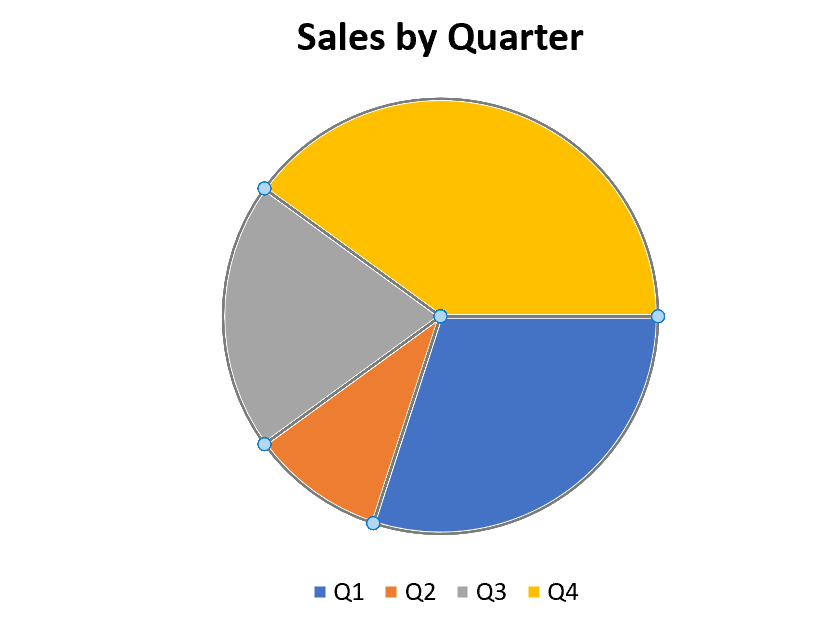
You can choose any angle to rotate the slices in the pie chart in a clockwise rotation. For example, we could rotate each of the slices 90° clockwise:
This results in the following:
Or we could rotate each of the slices 180° clockwise:
And if we choose a full 360° then each of the slices in the chart will end up in the exact same positions they started in:

Additional Resources
How to Create and Interpret Box Plots in Excel
How to Create a Double Doughnut Chart in Excel
How to Create an Ogive Graph in Excel
