A sampling distribution is a probability distribution of a certain statistic based on many random samples from a single population.
This tutorial explains how to do the following with sampling distributions in Excel:
- Generate a sampling distribution.
- Visualize the sampling distribution.
- Calculate the mean and standard deviation of the sampling distribution.
- Calculate probabilities regarding the sampling distribution.
Generate a Sampling Distribution in Excel
Suppose we would like to generate a sampling distribution composed of 1,000 samples in which each sample size is 20 and comes from a normal distribution with a mean of 5.3 and a standard deviation of 9.
We can easily do this by typing the following formula in cell A2 of our worksheet:
=NORM.INV(RAND(), 5.3, 9) We can then hover over the bottom right corner of the cell until a tiny + appears and drag the formula to the right 20 cells and down 1,000 cells:

Each row represents a sample of size 20 in which each value comes from a normal distribution with a mean of 5.3 and a standard deviation of 9.
Find the Mean & Standard Deviation
To find the mean and standard deviation of this sampling distribution of sample means, we can first find the mean of each sample by typing the following formula in cell U2 of our worksheet:
=AVERAGE(A2:T2) We can then hover over the bottom right corner of the cell until a tiny + appears and double click to copy this formula to every other cell in column U:
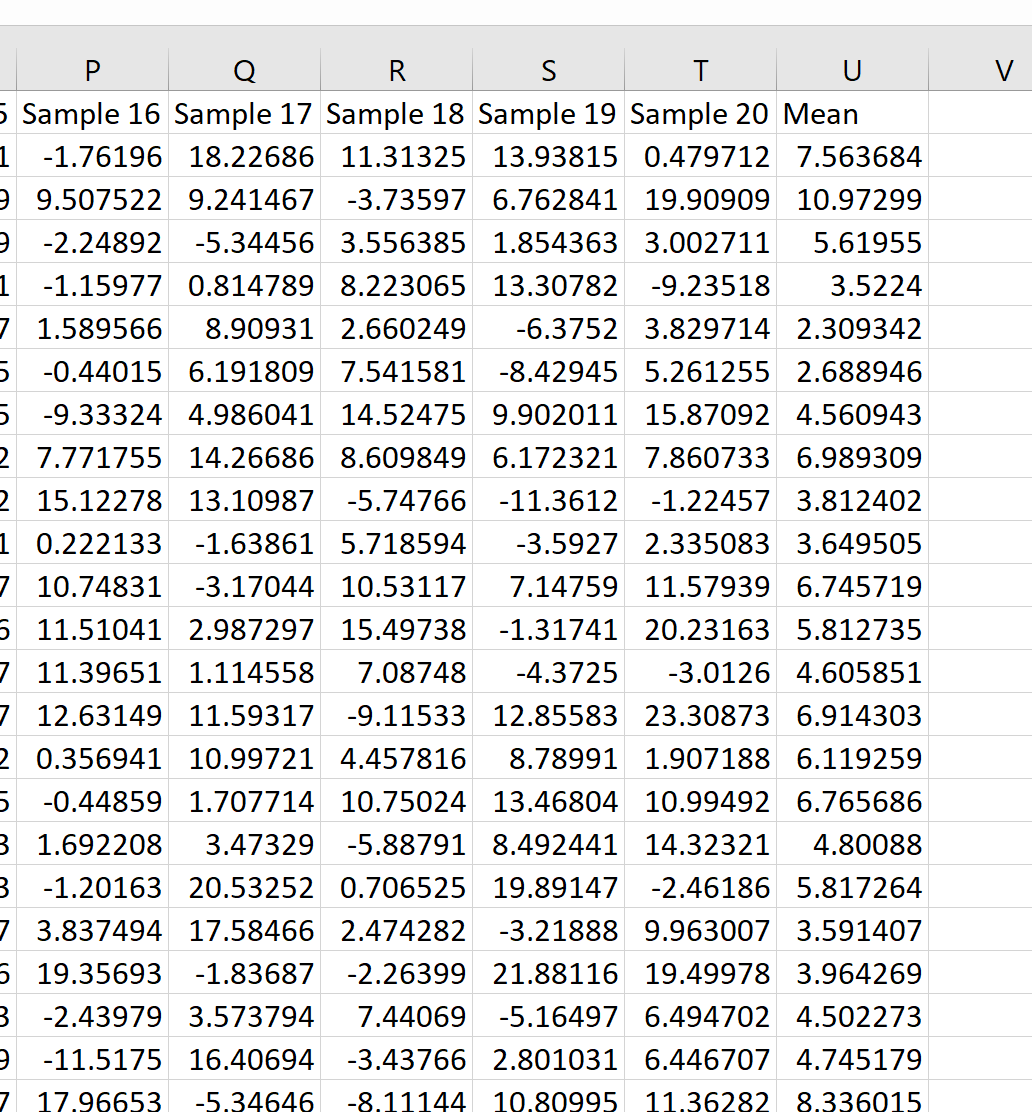
We can see that the first sample had a mean of 7.563684, the second sample had a mean of 10.97299, and so on.
We can then use the following formulas to calculate the mean and the standard deviation of the sample means:
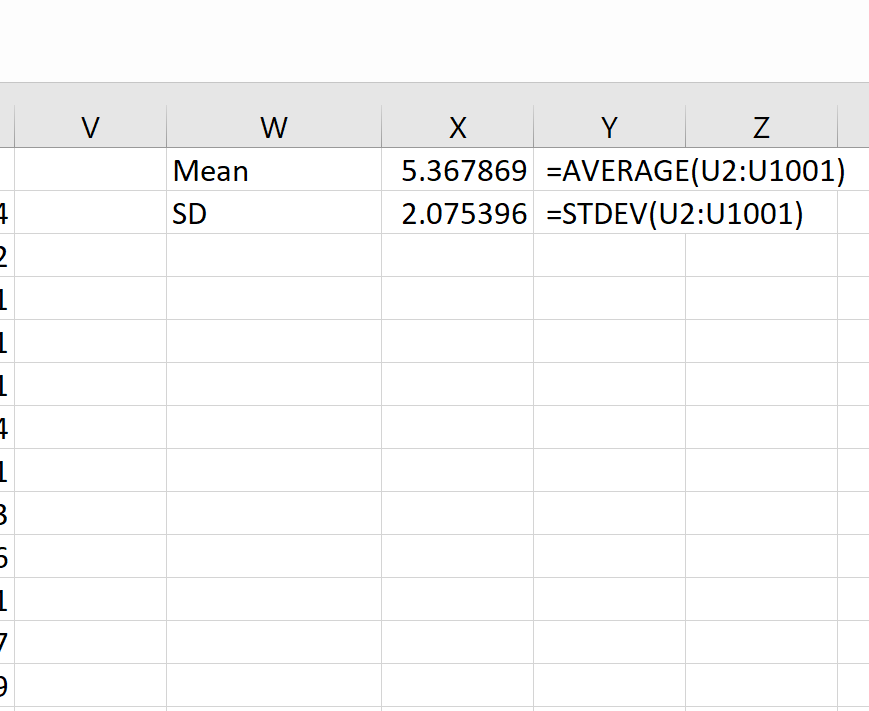
Theoretically the mean of the sampling distribution should be 5.3. We can see that the actual sampling mean in this example is 5.367869, which is close to 5.3.
And theoretically the standard deviation of the sampling distribution should be equal to s/√n, which would be 9 / √20 = 2.012. We can see that the actual standard deviation of the sampling distribution is 2.075396, which is close to 2.012.
Visualize the Sampling Distribution
We can also create a simple histogram to visualize the sampling distribution of sample means.
To do so, simply highlight all of the sample means in column U, click the Insert tab, then click the Histogram option under the Charts section.
This results in the following histogram:
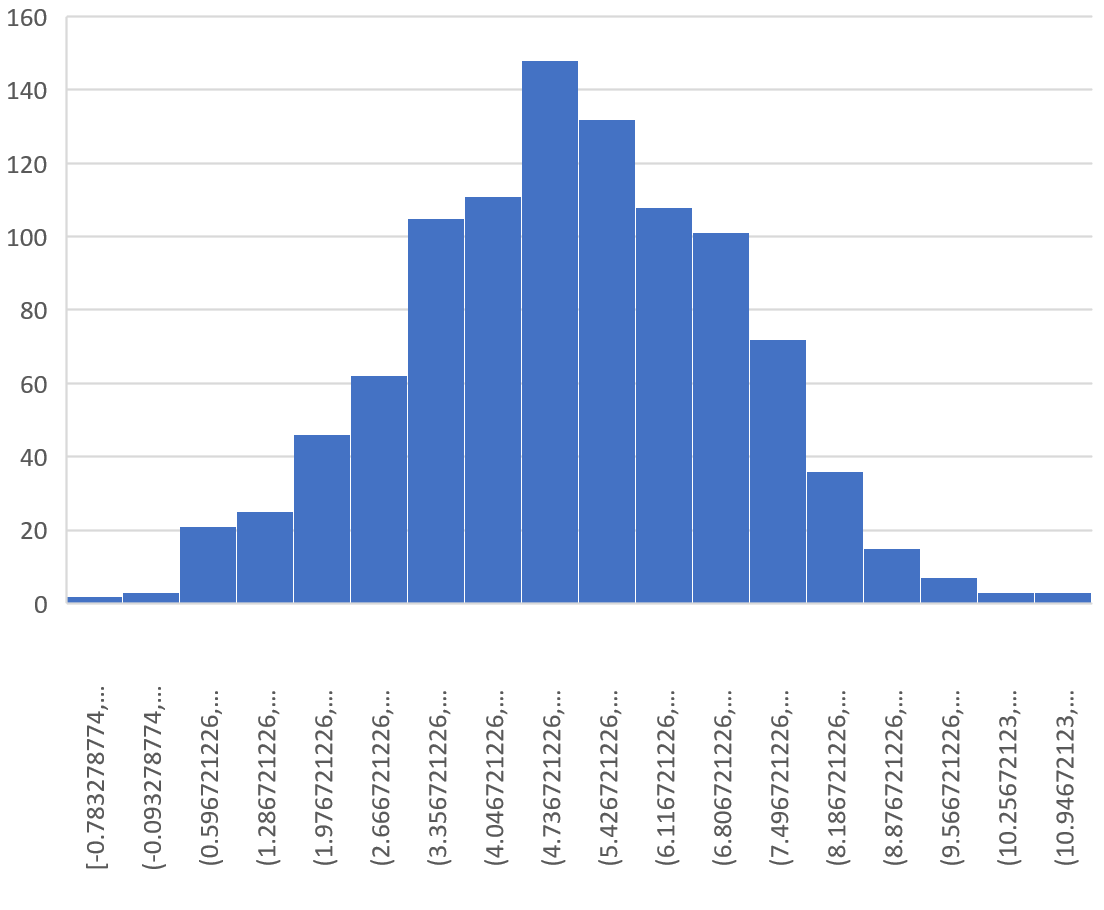
We can see that the sampling distribution is bell-shaped with a peak near the value 5.
From the tails of the distribution, however, we can see that some samples had means greater than 10 and some had means less than 0.
Calculate Probabilities
We can also calculate the probability of obtaining a certain value for a sample mean, based on a population mean, population standard deviation, and sample size.
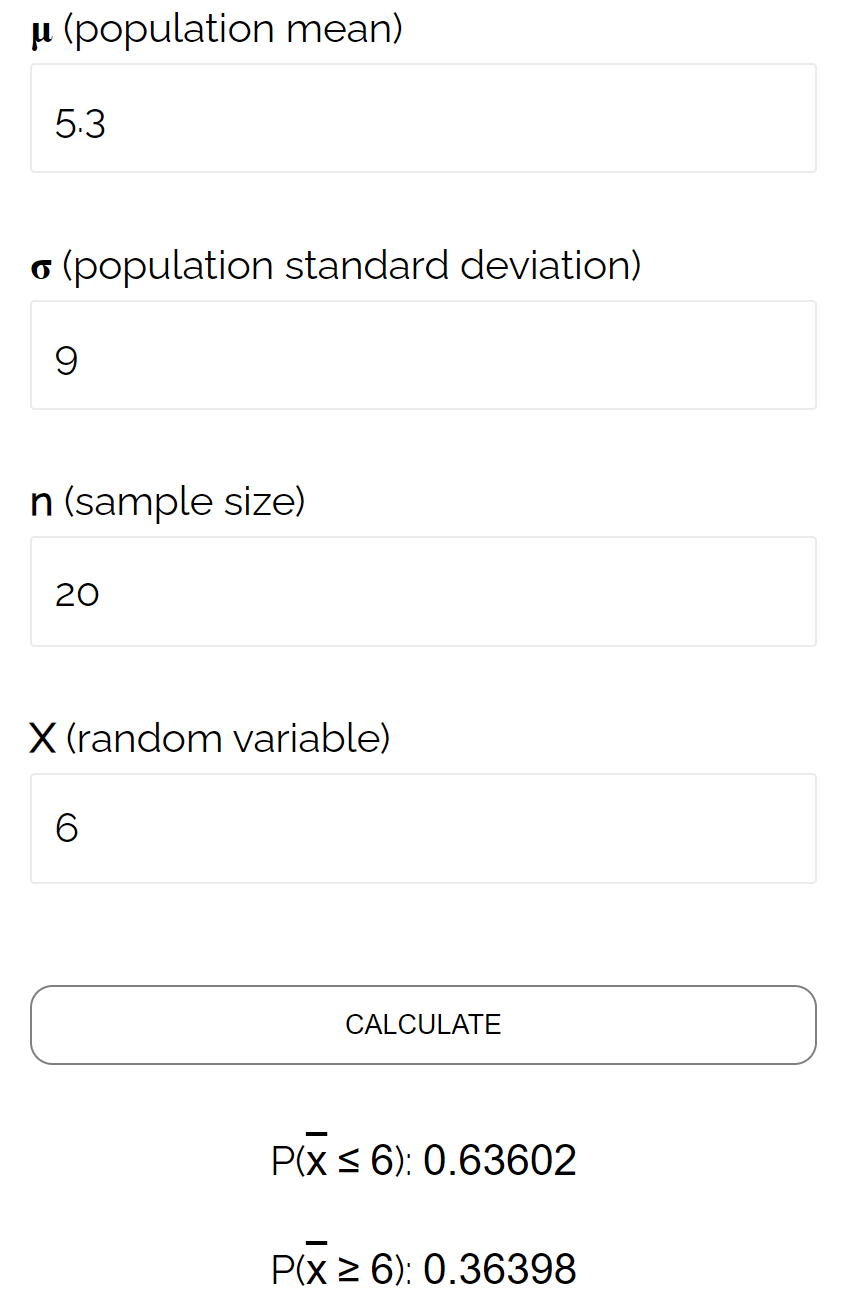
For example, we can use the following formula to find the probability that the sample mean is less than or equal to 6, given that the population mean is 5.3, the population standard deviation is 9, and the sample size is:
=COUNTIF(U2:U1001, "")/COUNT(U2:U1001)
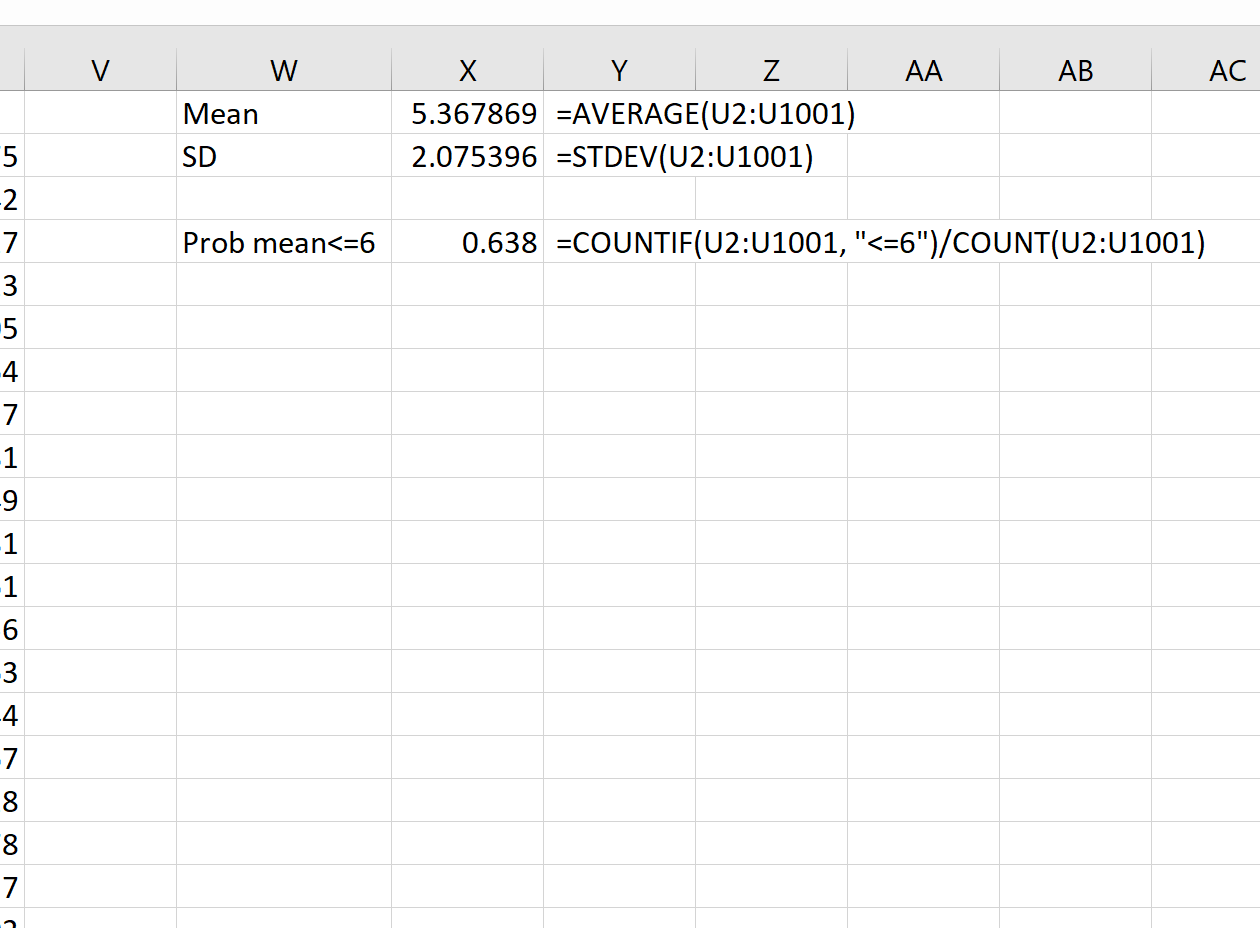
We can see that the probability that the sample mean is less than or equal to 6 is 0.638.
This is very close to the probability calculated by the Sampling Distribution Calculator:
Additional Resources
An Introduction to Sampling Distributions
Sampling Distribution Calculator
An Introduction to the Central Limit Theorem