An outlier is an observation that lies abnormally far away from other values in a dataset. Outliers can be problematic because they can affect the results of an analysis.
The most common way to identify outliers in a dataset is by using the interquartile range.
The interquartile range (IQR) is the difference between the 75th percentile (Q3) and the 25th percentile (Q1) in a dataset. It measures the spread of the middle 50% of values.
We typically define an observation to be an outlier if it is 1.5 times the interquartile range greater than the third quartile (Q3) or 1.5 times the interquartile range less than the first quartile (Q1).
Outliers = Observations > Q3 + 1.5*IQR or
The following example shows how to use this formula to identify outliers in a dataset in SAS.
Example: Identifying Outliers in SAS
Suppose we have the following dataset in SAS:
/*create dataset*/
data original_data;
    input team $ points;
    datalines;
A 18
B 24
C 26
D 34
E 38
F 45
G 48
H 54
I 60
J 73
K 79
L 85
M 94
N 98
O 221
P 223
;
run;

/*view dataset*/
proc print data=original_data;

The easiest way to identify outliers in SAS is by creating a boxplot, which automatically uses the formula mentioned earlier to identify and display outliers in the dataset as tiny circles:
/*create boxplot to visualize distribution of points*/
ods output sgplot=boxplot_data;
proc sgplot data=original_data;
vbox points;
run;
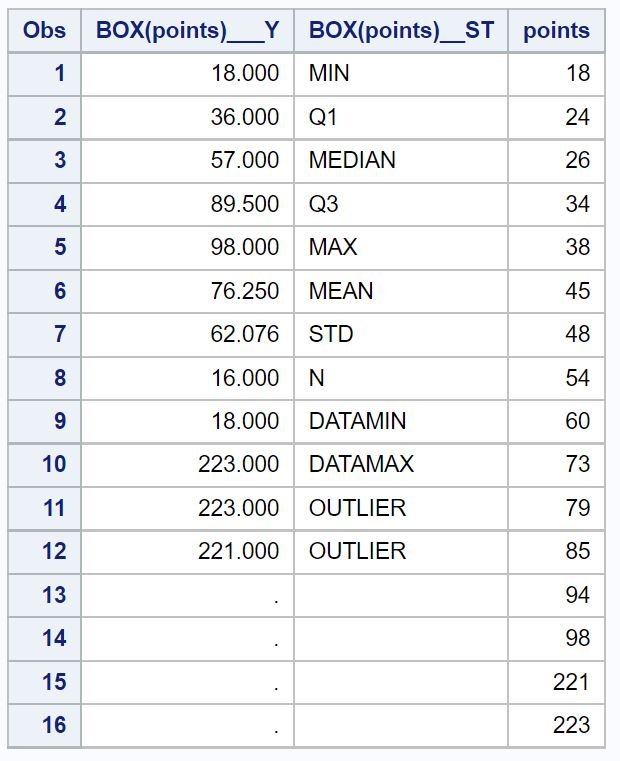
/*view summary of boxplot descriptive statistics*/
proc print data=boxplot_data; 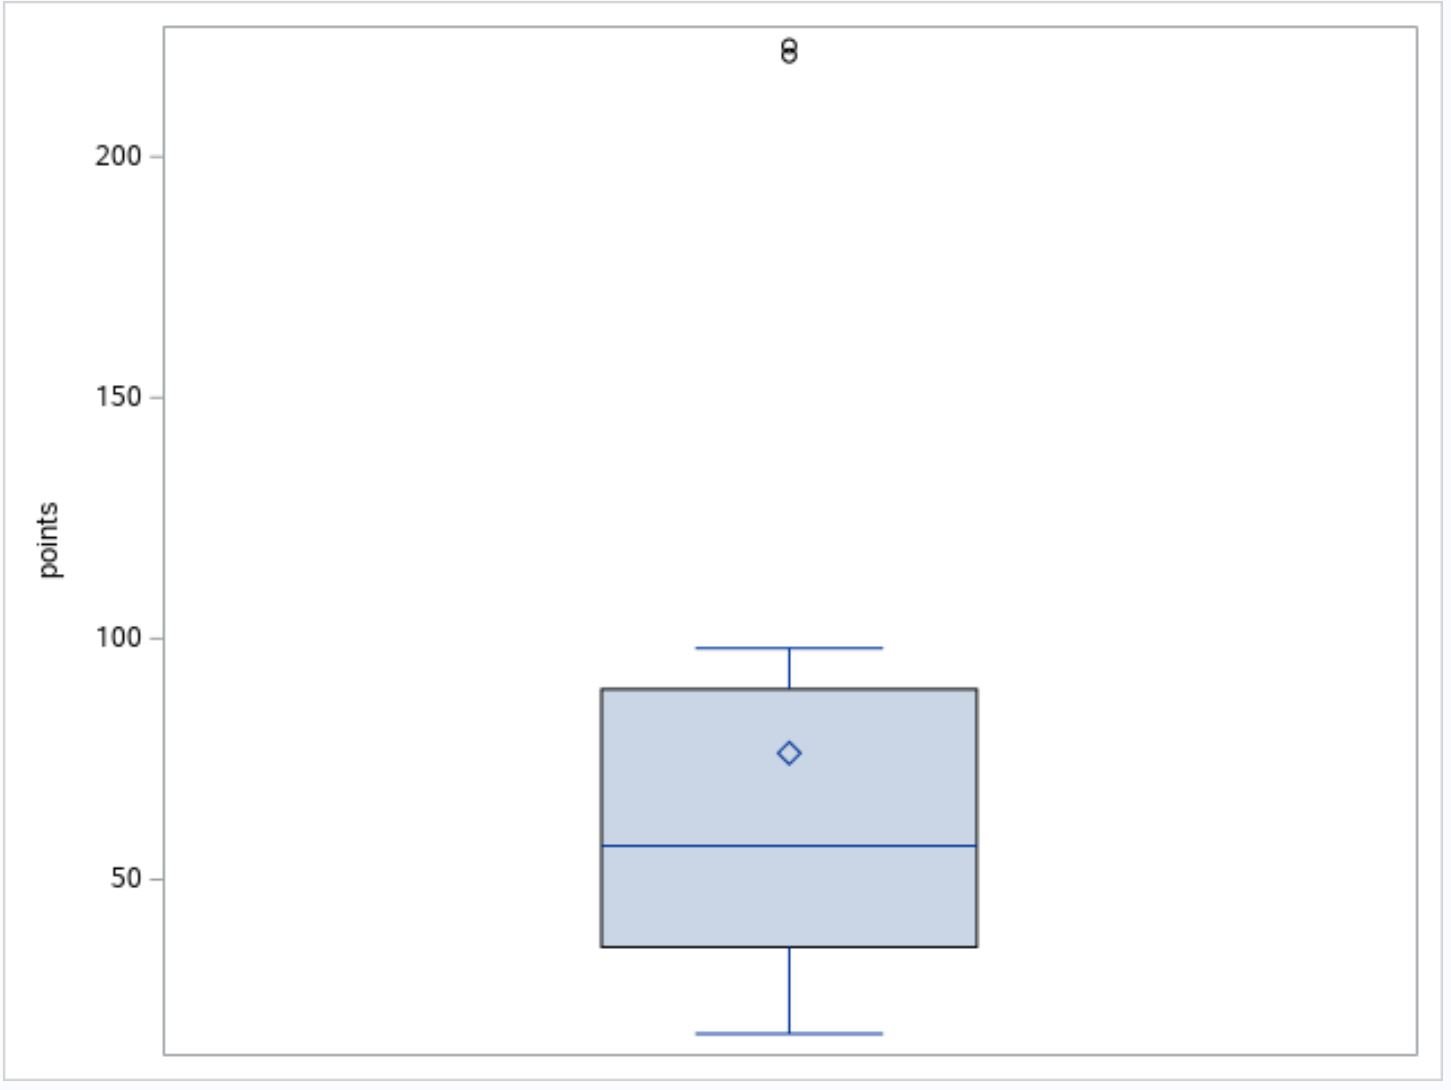
From the boxplot we can see that there are two tiny circles near the top of the plot. This indicates that there are two outliers.
From the table below the boxplot we can see the exact values for the two outliers: 221 and 223.
We can manually verify that these two values are outliers by using the formula from earlier:
Outliers = Observations > Q3 + 1.5*IQR or
The interquartile range is: Q3 – Q1 = 89.5 – 36 = 53.5.
The upper limit for outliers would be: Q3 + 1.5*IQR = 89.5 + 1.5*53.5 = 169.75.
Since 221 and 223 are both greater than this value, they are classified as outliers.
We could then use the following code to remove these two outliers from the dataset if we’d like:
/*create new dataset with outliers removed*/
data new_data;
    set original_data;
    if points >= 221 then delete;
run;

/*view new dataset*/
proc print data=new_data; 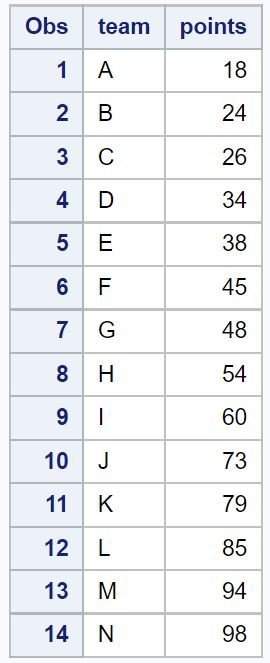
Notice that the two outliers have been removed.
Additional Resources
The following tutorials explain how to perform other common tasks in SAS:
How to Use Proc Summary in SAS
How to Use Proc Tabulate in SAS
How to Calculate Correlation in SAS
How to Create Frequency Tables in SAS
How to Replace Missing Values with Zero in SAS