You can use the FacetGrid() function to create multiple Seaborn plots in one figure:
#define grid
g = sns.FacetGrid(data=df, col='variable1', col_wrap=2)

#add plots to grid
g.map(sns.scatterplot, 'variable2', 'variable3')
Note that the col argument specifies the variable to group by and the col_wrap argument specifies the number of plots to display per row.
The following examples show how to use this function in practice with the built-in ‘tips’ dataset:
#load tips dataset
tips = sns.load_dataset('tips')

#view first five rows of tips dataset
tips.head()

   total_bill	tip	sex	smoker	day	time	size
0	16.99	1.01	Female	No	Sun	Dinner	2
1	10.34	1.66	Male	No	Sun	Dinner	3
2	21.01	3.50	Male	No	Sun	Dinner	3
3	23.68	3.31	Male	No	Sun	Dinner	2
4	24.59	3.61	Female	No	Sun	Dinner	4
Example 1: Create Multiple Plots
The following code shows how to create multiple Seaborn plots in one figure:
#define grid with two plots per row
g = sns.FacetGrid(data=tips, col='day', col_wrap=2)

#add histograms to each plot
g.map(sns.histplot, 'tip') 
Here’s what we did with this simple code:
- Specified to group by the variable ‘day’
- Specified to display 2 plots per row
- Specified to display a histogram in each plot that shows the distribution of ‘tip’ values for each particular day
Example 2: Create Multiple Plots with Specific Height
The following code shows how to create multiple Seaborn plots with a specific height and aspect ratio:
#define grid
g = sns.FacetGrid(data=tips, col='day', col_wrap=2, height=4, aspect=.75)

#add histograms to each plot
g.map(sns.histplot, 'tip') 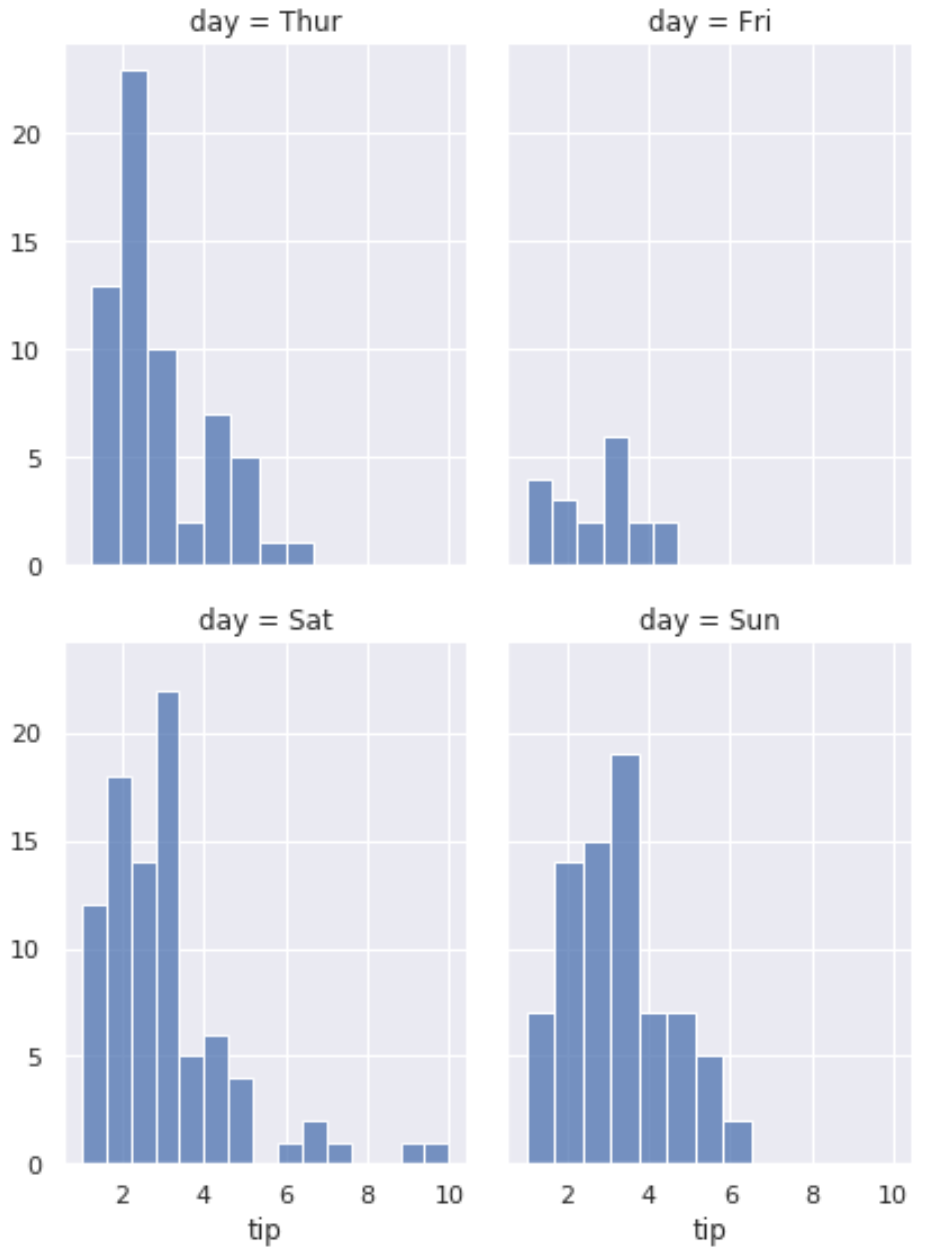
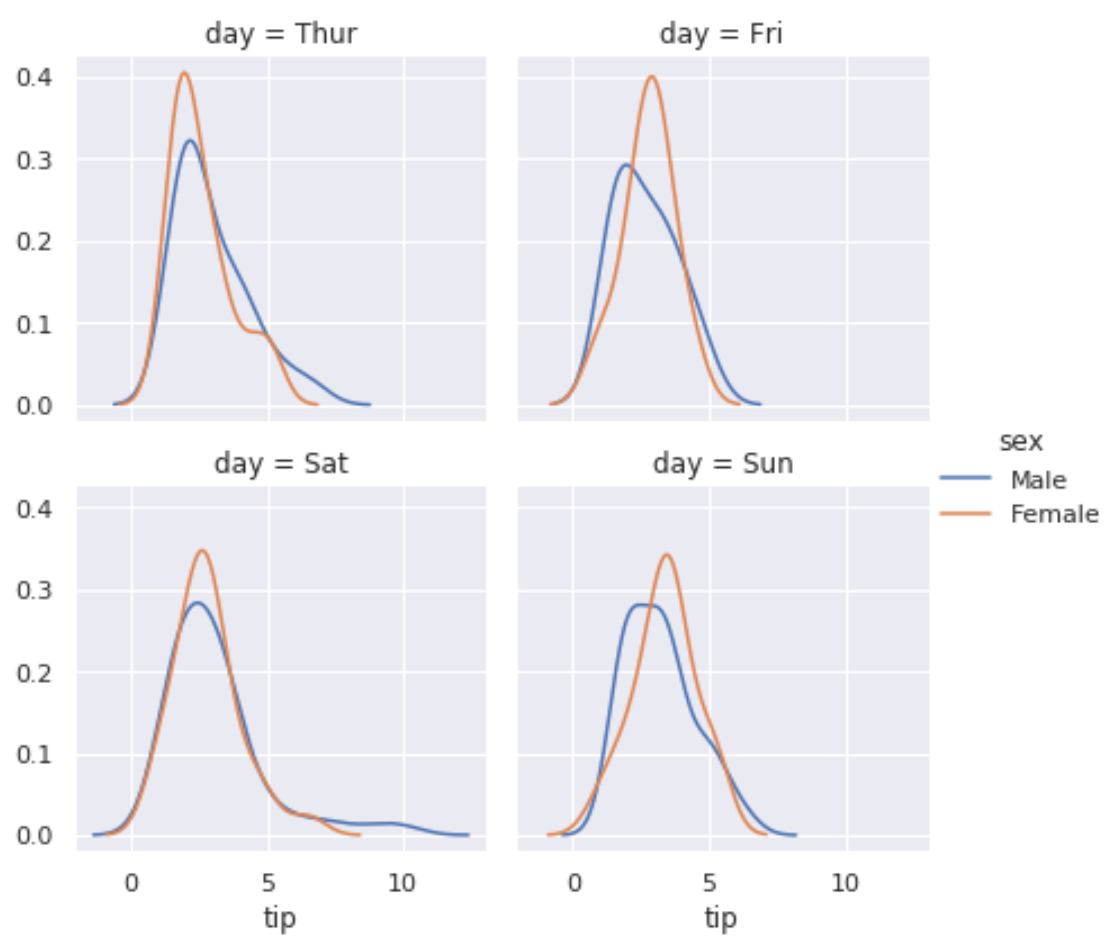
Example 3: Create Multiple Plots with Legend
The following code shows how to create multiple Seaborn plots and add a legend:
#define grid
g = sns.FacetGrid(data=tips, col='day', hue='sex', col_wrap=2)

#add density plots to each plot
g.map(sns.kdeplot, 'tip')

#add legend
g.add_legend()
Additional Resources
How to Add a Title to Seaborn Plots
How to Change the Position of a Legend in Seaborn
How to Adjust the Figure Size of a Seaborn Plot