96
Often you may want to create two plots side-by-side using the ggplot2 package in R. Fortunately this is easy to do with the help of the patchwork package.
#install ggplot2 and patchwork packages
install.packages('ggplot2')
install.packages('patchwork')

#load the packages
library(ggplot2)
library(patchwork)
This tutorial shows several examples of how to use these packages to create side-by-side plots.
Example 1: Two Side-by-Side Plots
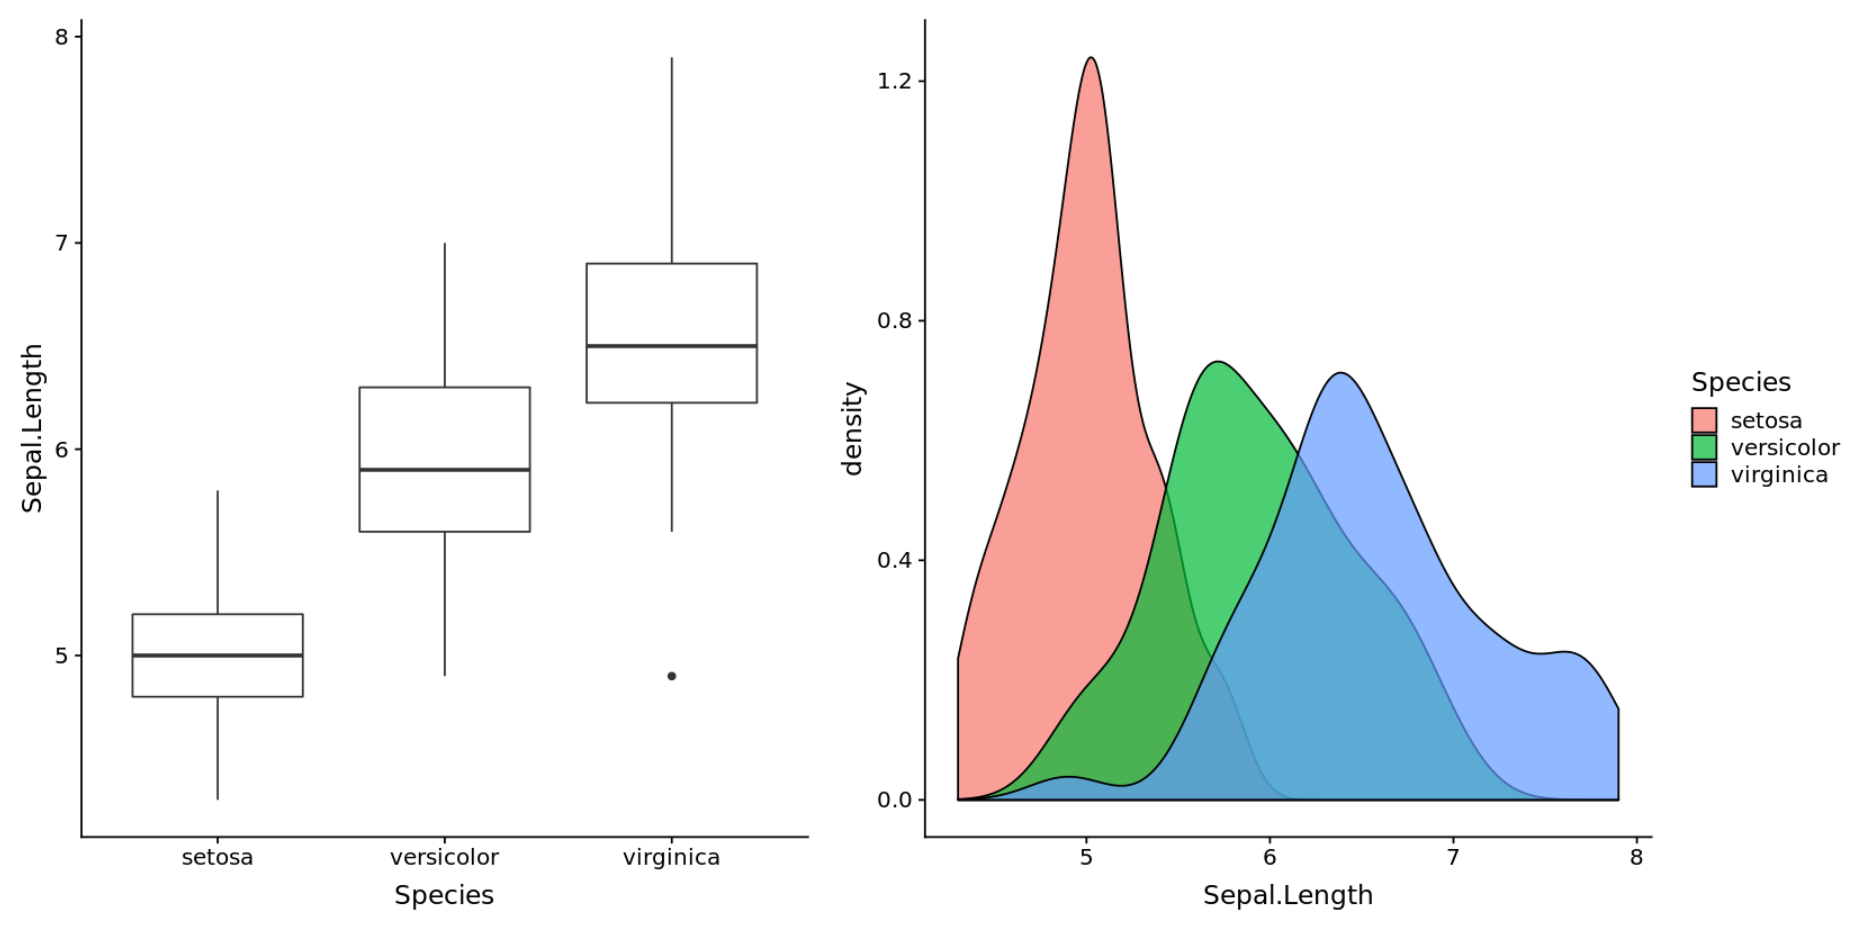
The following code shows how to create two side-by-side plots using the R built-in iris dataset:
#create box plot
plot1 #create density plot
plot2 #display plots side by side
plot1 + plot2
Example 2: Three Side-by-Side Plots
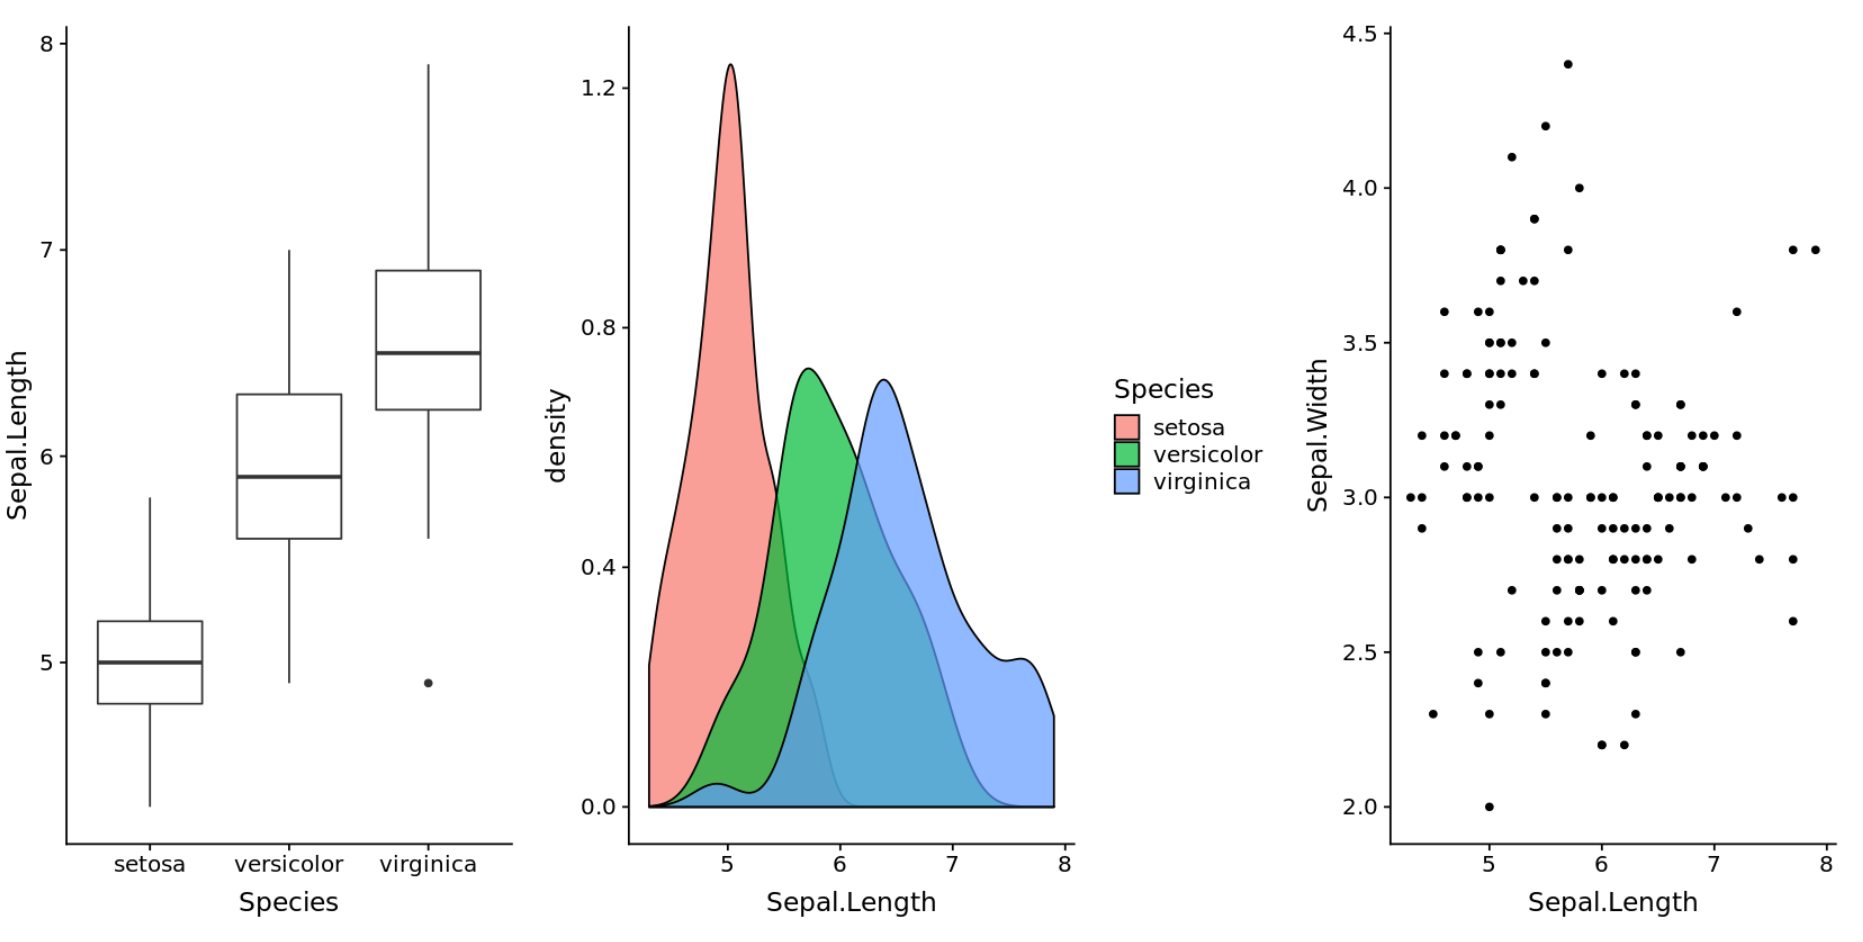
The following code shows how to create three side-by-side plots using the R built-in iris dataset:
#create box plot
plot1 #create density plot
plot2 #create scatterplot
plot3 #display three plots side by side
plot1 + plot2 + plot3
Example 3: Two Stacked Plots
The following code shows how to create two stacked plots, one on top of the other:
#create box plot
plot1 #create density plot
plot2 #display plots stacked on top of each other
plot1 / plot2 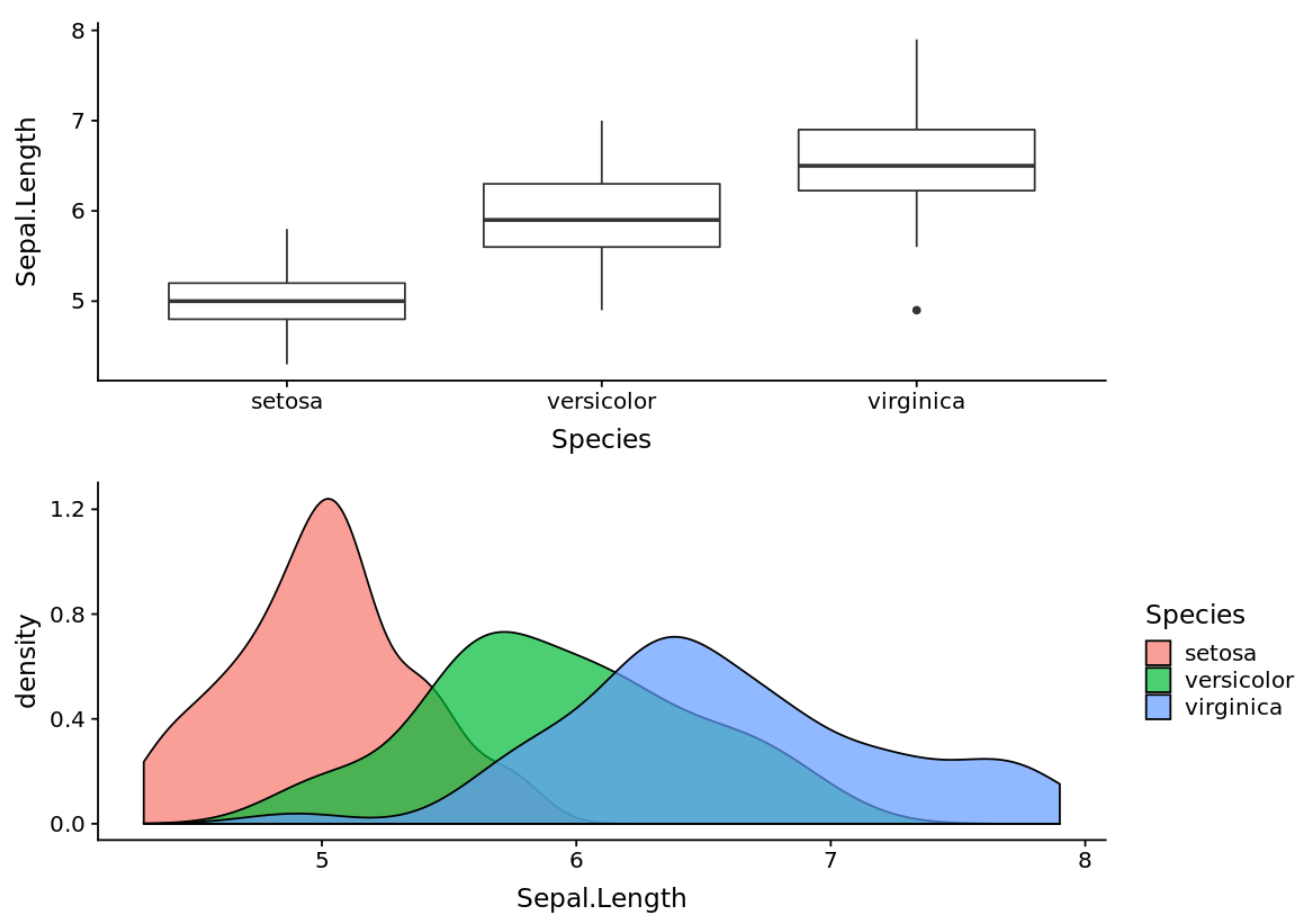
Example 4: Add Titles, Subtitles, and Captions
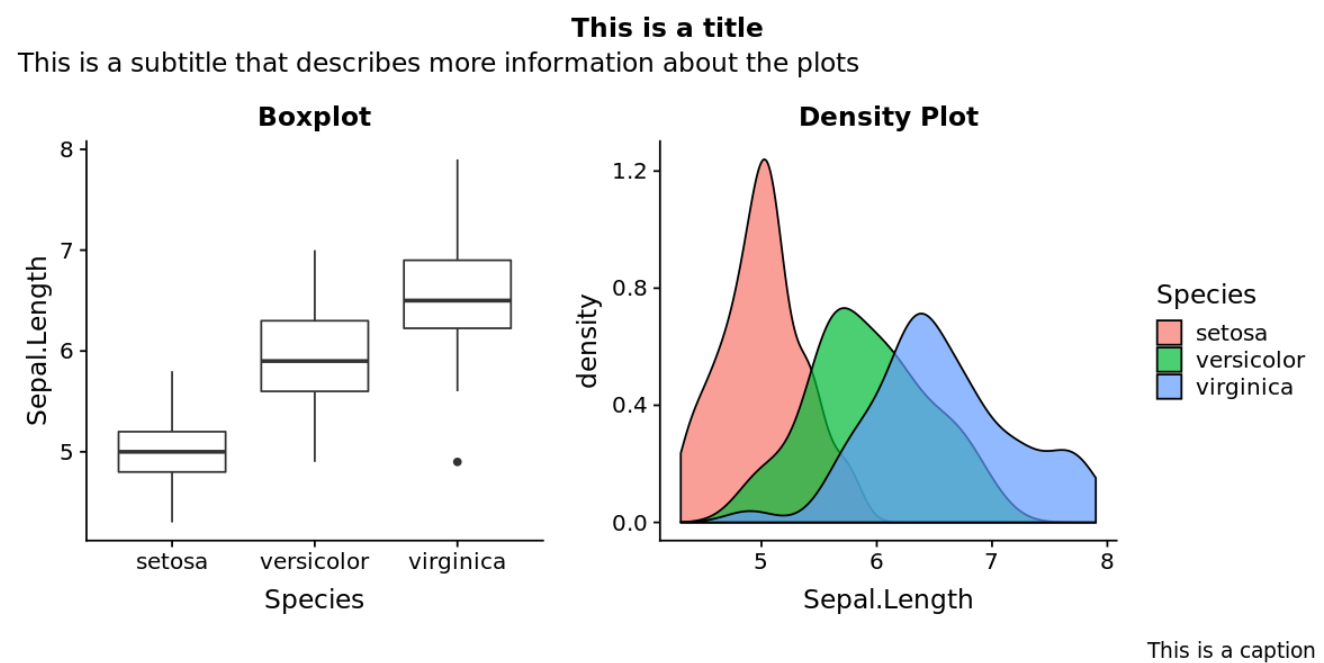
The following code shows how to add titles, subtitles, and captions to the plots:
#create box plot
plot1 #create density plot
plot2 #display plots side by side with title, subtitle, and captions
patchwork This is a title',
  subtitle = 'This is a subtitle that describes more information about the plots',
  caption = 'This is a caption'
)
You can find more R tutorials here.