A sign-test is a non-parametric test that is used to determine whether a population median is equal to some value.
The following step-by-step example shows how to perform a sign test in Excel.
Step 1: Enter the Data
Suppose a manufacturing plant claims to produce widgets that weigh 50 pounds. To test this, an inspector goes out to the plant and randomly measures the weight of 20 widgets.
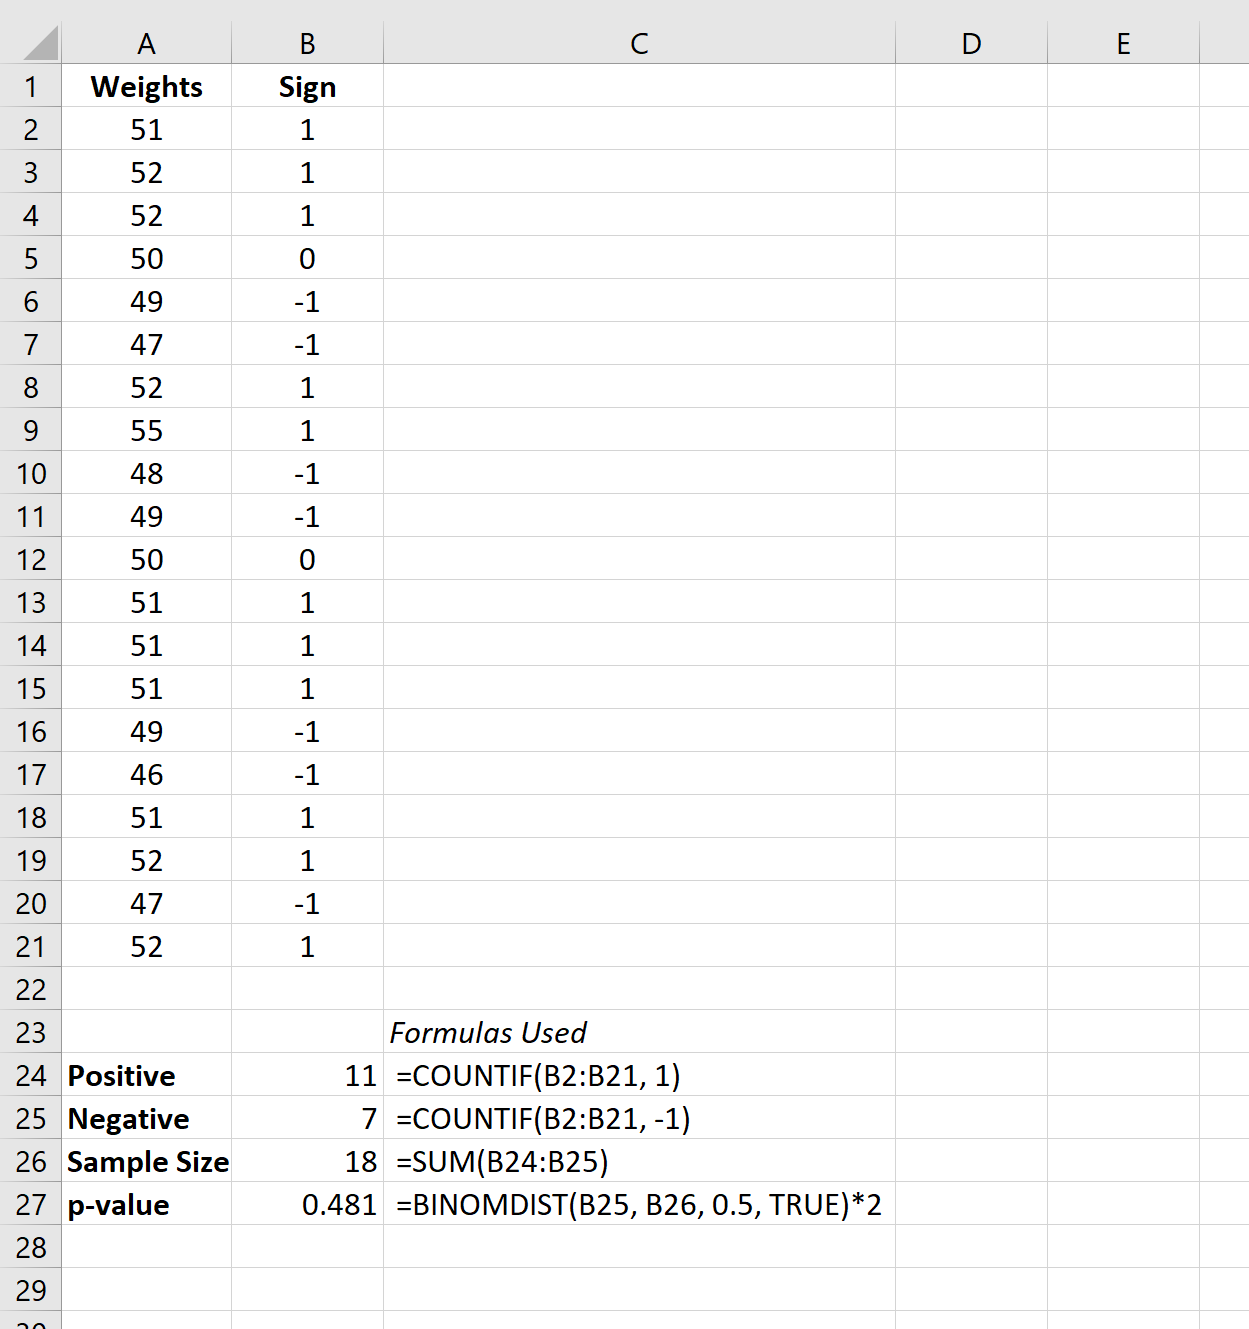
He then enters the following weights for each widget:

We can perform a sign test to determine if the median weight is significantly different from 50 pounds.
Step 2: Calculate the Signs
Next, let’s calculate the signs of each widget using the following rules:
- If the weight of a widget is less than 50, assign it a sign of -1
- If the weight of a widget is equal to 50, assign it a sign of 0
- If the weight of a widget is greater than 50, assign it a sign of 1
We’ll use the following formula in Excel to do so:

Step 3: Calculate the P-Value of the Test
Lastly, we’ll use the following formulas to calculate the total positive signs and negative signs and calculate the corresponding p-value of the sign test:

The sign test uses the following null and alternative hypotheses:
- H0: Population median weight = 20 pounds
- HA: Population median weight ≠ 20 pounds
Since the p-value is not less than .05, we fail to reject the null hypothesis. This means we don’t have sufficient evidence to say that the true median weight of widgets produced is different than 50 pounds.
Note: In this example, we multiplied the p-value by two since we performed a two-sided test. We also used the smaller of the negative and positive counts since we used a two-sided test.
Additional Resources
The following tutorials explain how to perform other common statistical tests in Excel:
How to Conduct a One Sample t-Test in Excel
How to Conduct a Two Sample t-Test in Excel
How to Conduct a Paired Samples t-Test in Excel
How to Perform a Normality Test in Excel
