Skewness is a measure of the asymmetry of a dataset or distribution. This value can be positive or negative. It’s useful to know because it helps us understand the shape of a distribution.
A negative skew indicates that the tail is on the left side of the distribution, which extends towards more negative values.
A positive skew indicates that the tail is on the right side of the distribution, which extends towards more positive values.
A value of zero indicates that there is no skewness in the distribution at all, meaning the distribution is perfectly symmetrical. This is unusual and rarely occurs in practice.
How to Calculate Skewness in Excel
Excel offers the following built-in function to calculate the skewness of a distribution:
=SKEW(array of values)
This function uses the following formula to calculate skewness:
Skewness = [n/(n-1)(n-2)] * Σ[(xi–x)/s]3
where:
n = sample size
Σ = fancy symbol that means “sum”
xi = the value of the ith value in the dataset
x = mean
s = standard deviation
The formula is a bit complex, but luckily Excel performs this calculation for you so that you don’t have to do it manually.
Example: Calculating Skewness in Excel
Suppose we have the following dataset that contains the exam scores of 20 students:

We can calculate the skewness of the distribution using =SKEW(A2:A21)

This tells us that the skewness of this dataset is -0.1849. Since this value is negative, we know that the tail of the distribution extends towards the left.
Technical Note:
The SKEW() function will return the error #DIV/0! in the following two scenarios:
- If there are fewer than three data points
- If the sample standard deviation is zero
Additional Resource: Skewness & Kurtosis Calculator
You can also calculate the skewness for a given dataset using the Statology Skewness and Kurtosis Calculator, which automatically calculates both the skewness and kurtosis for a given dataset. You simply enter the raw data values for your dataset into the input box, then click “Calculate.”
For example, here is how to calculate the skewness for the dataset from the example above:
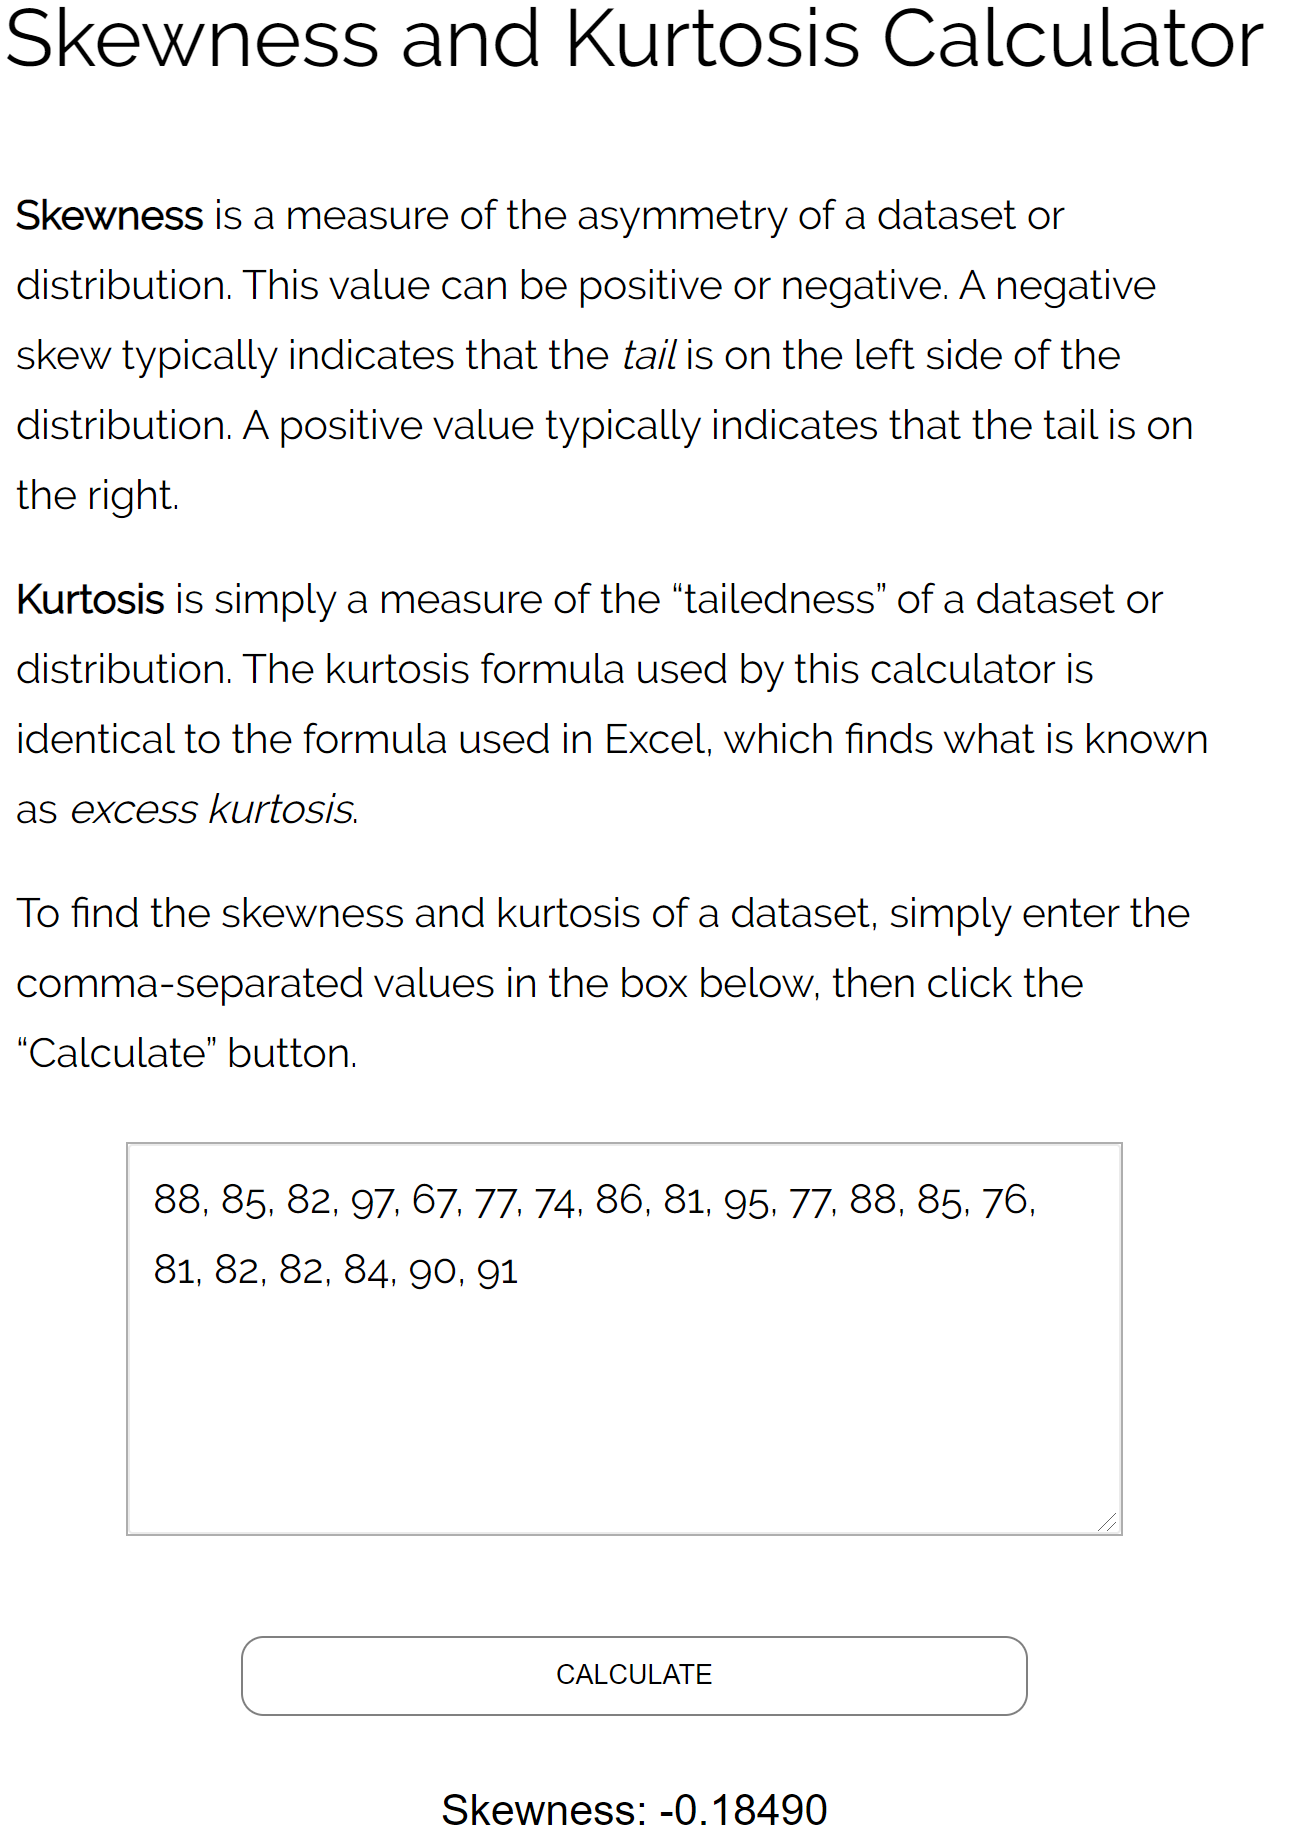
Note that the skewness value from the calculator matches the skewness value that we found in Excel.