Standardization and normalization are two ways to rescale data.
Standardization rescales a dataset to have a mean of 0 and a standard deviation of 1. It uses the following formula to do so:
xnew = (xi – x) / s
where:
- xi: The ith value in the dataset
- x: The sample mean
- s: The sample standard deviation
Normalization rescales a dataset so that each value falls between 0 and 1. It uses the following formula to do so:
xnew = (xi – xmin) / (xmax – xmin)
where:
- xi: The ith value in the dataset
- xmin: The minimum value in the dataset
- xmax: The maximum value in the dataset
The following examples show how to standardize and normalize a dataset in practice.
Example: How to Standardize Data
Suppose we have the following dataset:

The mean value in the dataset is 43.15 and the standard deviation is 22.13.
To normalize the first value of 13, we would apply the formula shared earlier:
- xnew = (xi – x) / s = (13 – 43.15) / 22.13 = -1.36
To normalize the second value of 16, we would use the same formula:
- xnew = (xi – x) / s = (16 – 43.15) / 22.13 = -1.23
To normalize the third value of19, we would use the same formula:
- xnew = (xi – x) / s = (19 – 43.15) / 22.13 = -1.09
We can use this exact same formula to standardize each value in the original dataset:

Example: How to Normalize Data
Once again, suppose we have the following dataset:
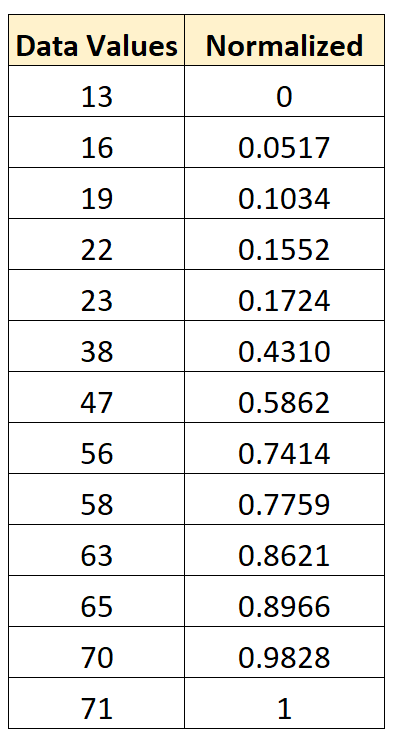
The minimum value in the dataset is 13 and the maximum value is 71.
To normalize the first value of 13, we would apply the formula shared earlier:
- xnew = (xi – xmin) / (xmax – xmin) = (13 – 13) / (71 – 13) = 0
To normalize the second value of 16, we would use the same formula:
- xnew = (xi – xmin) / (xmax – xmin) = (16 – 13) / (71 – 13) = .0517
To normalize the third value of19, we would use the same formula:
- xnew = (xi – xmin) / (xmax – xmin)= (19 – 13) / (71 – 13) = .1034
We can use this exact same formula to normalize each value in the original dataset to be between 0 and 1:
Standardization vs. Normalization: When to Use Each
Typically we normalize data when performing some type of analysis in which we have multiple variables that are measured on different scales and we want each of the variables to have the same range.
This prevents one variable from being overly influential, especially if it’s measured in different units (i.e. if one variable is measured in inches and another is measured in yards).
On the other hand, we typically standardize data when we’d like to know how many standard deviations each value in a dataset lies from the mean.
For example, we might have a list of exam scores for 500 students at a particular school and we’d like to know how many standard deviations each exam score lies from the mean score.
In this case, we could standardize the raw data to find out this information. Then, a standardized score of 1.26 would tell us that the exam score of that particular student lies 1.26 standard deviations above the mean exam score.
Whether you decide to normalize or standardize your data, keep the following in mind:
- A normalized dataset will always have values that range between 0 and 1.
- A standardized dataset will have a mean of 0 and standard deviation of 1, but there is no specific upper or lower bound for the maximum and minimum values.
Depending on your particular scenario, it may make more sense to normalize or standardize the data.
Additional Resources
The following tutorials explain how to standardized and normalize data in different statistical software:
How to Normalize Data in R
How to Normalize Data in Excel
How to Normalize Data in Python
How to Standardize Data in R