A strip chart is a type of chart that displays numerical data along a single strip. Similar to boxplots, strip charts can help you visualize the distribution of data. Strip charts can be a good alternative to boxplots when the sample sizes are small so that you can see the individual data points.
This tutorial explains how to create a strip chart in R using the built-in stripchart() function.
The stripchart() function
The basic syntax to create a strip chart in R is as follows:
stripchart(x, method, jitter, main, xlab, ylab, col, pch, vertical, group.names)
- x: a numeric vector or a list of numeric vectors to be plotted. This is the only required argument to produce a plot.
- method: the method to be used to separate points that have identical values. The default method “overplot” causes such points to be overplotted, but it’s possible to specify “jitter” to jitter the points or “stack” to stack the points.
- jitter: when method = “jitter” is used, this provides the amount of jittering to be applied.
- main: title of the chart
- xlab: x-axis label
- ylab: y-axis label
- col: color of the points in the plot
- pch: shape of the points in the plot
- vertical: when vertical is “TRUE”, the plot is drawn vertically rather than the default horizontal
- group.names: group labels to be printed alongside the plot, if more than one numeric vector is being plotted.
Strip Chart for a Single Numeric Vector
The following example uses the built-in R dataset iris to create a strip chart for a single numeric vector.
#view first six rows of iris dataset
head(iris)

#  Sepal.Length Sepal.Width Petal.Length Petal.Width Species
#1          5.1         3.5          1.4         0.2  setosa
#2          4.9         3.0          1.4         0.2  setosa
#3          4.7         3.2          1.3         0.2  setosa
#4          4.6         3.1          1.5         0.2  setosa
#5          5.0         3.6          1.4         0.2  setosa
#6          5.4         3.9          1.7         0.4  setosa
The following code creates a basic strip chart for the variable Sepal.Length:
stripchart(iris$Sepal.Length)

We can also add additional arguments to add a title and x-axis label, change the color of the points, change the shape of the points, and use the method “jitter” so that individual points don’t overlap each other:
stripchart(iris$Sepal.Length,
           main = 'Sepal Length Distribution',
           xlab = 'Sepal Length',
           col = 'red',
           pch = 1,
method = 'jitter') 
Instead of jittering the points, we can “stack” them instead:
stripchart(iris$Sepal.Length,
           main = 'Sepal Length Distribution',
           xlab = 'Sepal Length',
           col = 'red',
           pch = 1,
method = 'stack') 
We can also display the plot vertically instead of the default horizontal, and change the axis label to be on the y-axis instead:
stripchart(iris$Sepal.Length,
           main = 'Sepal Length Distribution',
           ylab = 'Sepal Length',
           col = 'red',
           pch = 1,
           method = 'jitter',
vertical = TRUE) 
Strip Chart for Multiple Numeric Vectors
We can also draw multiple strip charts in a single plot by passing in a list of numeric vectors.
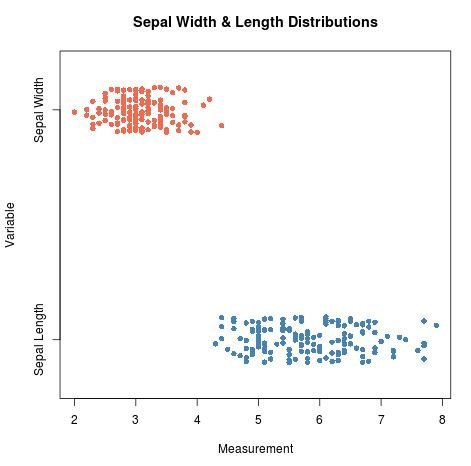
The following code creates a list that contains the variables Sepal Length and Sepal Width in the iris dataset and produces a strip chart for each variable in a single plot:
#create list of variables
x #create plot that contains one strip chart per variable
stripchart(x,
           main = 'Sepal Width & Length Distributions',
           xlab = 'Measurement',
           ylab = 'Variable',
           col = c('steelblue', 'coral2'),
           pch = 16,
method = 'jitter') 
Just as in the example before, we can choose to plot the strip charts vertically instead of the default horizontal:
stripchart(x, main = 'Sepal Width & Length Distributions',
           xlab = 'Measurement',
           ylab = 'Variable',
           col = c('steelblue', 'coral2'),
           pch = 16,
           method = 'jitter',
vertical = TRUE) 
In addition, we can pass a formula in the form of y~x into the stripchart() function, where y is a numeric vector grouped by the value of x.
For example, in the iris dataset we could group the data according to Species which has three distinct values (“setosa”, “versicolor”, and “virginica”) and then plot the Sepal Length for each species in a strip chart:
stripchart(Sepal.Length ~ Species,
           data = iris,
           main = 'Sepal Length by Species',
           xlab = 'Species',
           ylab = 'Sepal Length',
           col = c('steelblue', 'coral2', 'purple'),
           pch = 16,
           method = 'jitter',
vertical = TRUE) 
To view the full documentation on the stripchart() function in R, simply type in:
?stripchart
