The standard deviation is a mathematical term, and symbolizes the measurement of how spread out outlaid numbers are. We are going to make the standard deviation calculation.
Example 1 How to calculate Standard Deviation using STDEV Excel function?
Let's start from preparing your data. For this data we will see how to calculate Standard Deviation here.

Click on a blank column and type in =STDEV(choose all columns with numbers in it ex. A1:A11), and then press enter.

The Standard Deviation is calculated.

Simple and quick. Luckily Excel has dedicated STDEV function for Standard Deviation calculations. There are also other Excel functions:
- STDEV.P - standard deviation of population
- STDEV.S - sample standard deviation
- STDEVA - sample standard deviation which does not ignore logical values
- STDEVPA - standard deviation of population which does not ignore logical values
Example 2 Calculate Standard Deviation using Data Analysis ToolPak Add-In
First you need to make sure your Data Analysis Toolpak Add-In is installed. Here is the lesson how to install Data Analysis Toolpak Add-In.
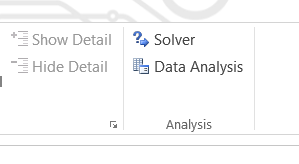
Go to Ribbon to the Data tab. Click the Data Analysis button.
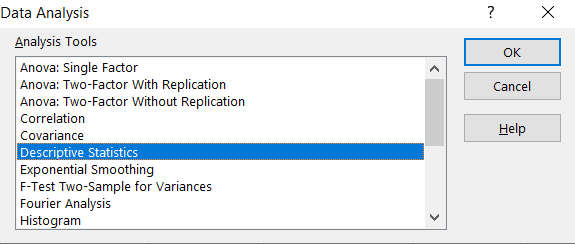
New window appears. Choose Descriptive Statistics and click OK.
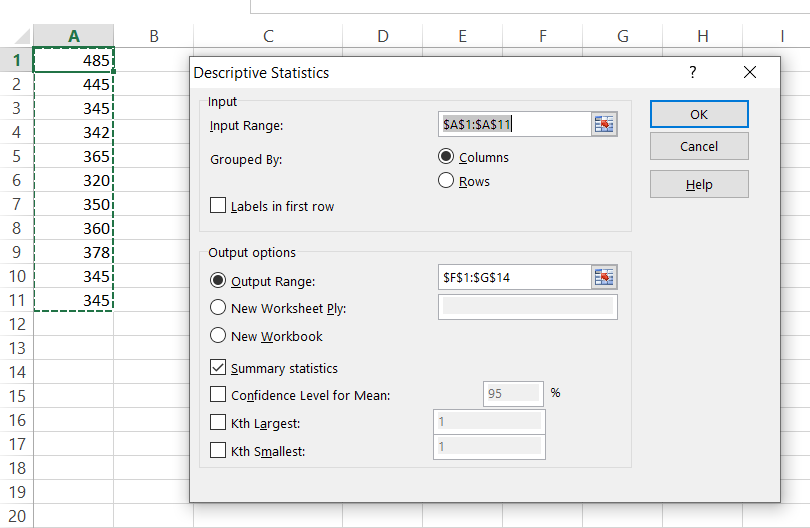
Enter the proper parameters:
- Input Range - range of your data ($A$1:$A$11 in my example)
- Labels in first row - there are no labels in my data table
- Output Range - choose where you want to get your standard deviation calculated (I chose the same Sheet $F$1:$G$14)
- Summary statistics - make sure it is checked
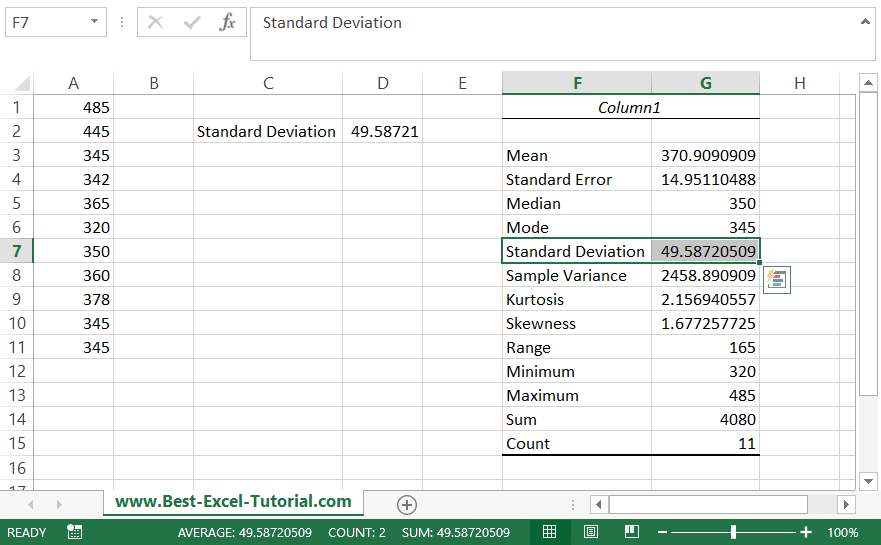
And this is how to see my Statistics summary. Standard Deviation is calculated in row 7. The result is the same as in the Example 1 where we checked how to calculate Standard Deviation using STDEV Excel function.
Excel really helps you with statistics. Hopely now you can see that.
Further reading:
Statistical process control chart
Calculating forecast accuracy and precision
How to calculate the variance in Excel?