Follow this steps below to create an interactive dashboard.
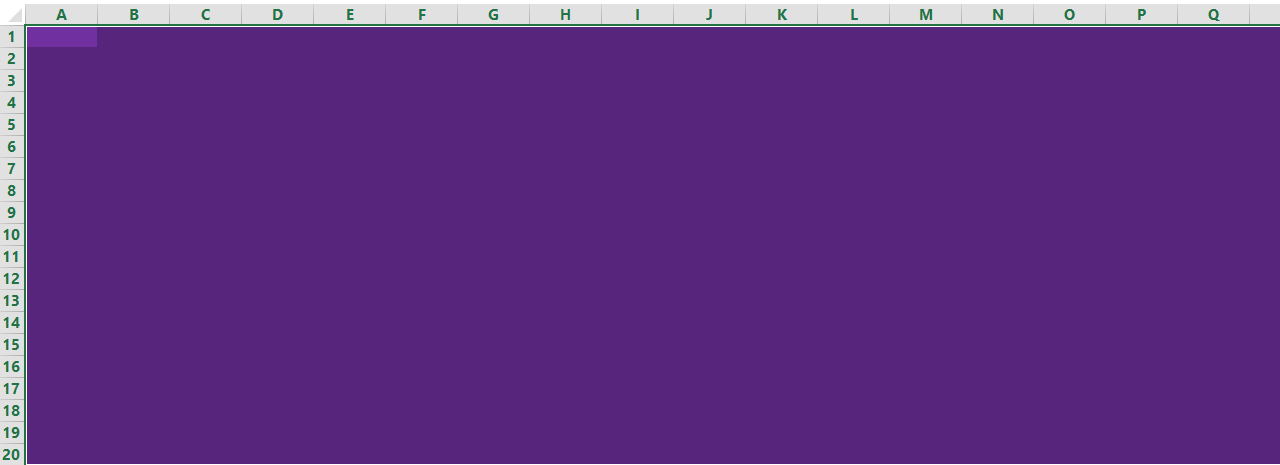
First you have to create the background. Do this by selecting many cells and changing the background color. In this case we have hanged the background color to violet.

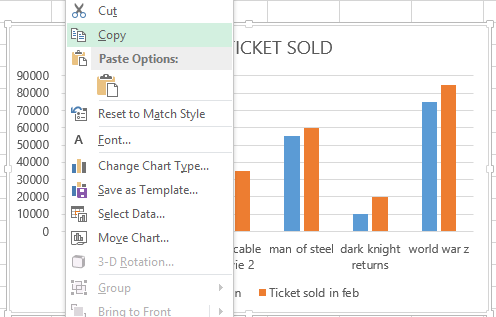
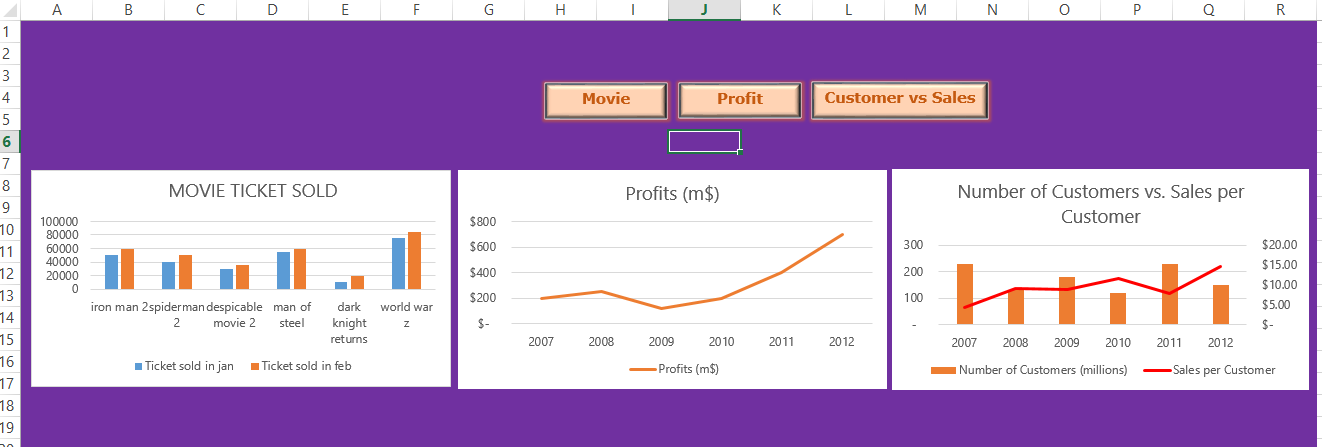
After creating the background you will use the data within the other spreadsheets to create the visual elements for the dashboard. Once you have created each visual element, copy and paste the charts, graphs, and tables from the other spreadsheet to your dashboard.

Now you have to create interactive buttons. Interactive buttons will allow users to "drill down" to see more details about the information displayed on the dashboard. By adding buttons onto the dashboard, any user that would like to visit a specific spreadsheet containing raw data. To create a "button" add a rectangle shape to the dashboard, apply bevel effects and change any other formatting, if desired. Add text to the shape that describes where the button will take the user, when clicked.

Now you need to hyperlink the rectangle button to the appropriate sheet. Right Click on the rectangle button, then click on the Insert tab, and then click on Hyperlink. A dialog box will appear. Click on Place in This Document and select the appropriate spreadsheet linked to your graph. (In this case we select Bar chart for the button movies).

Click on the rectangle buttons to go to the other spreadsheet containing raw data of your graph, charts etc. That's it, you have now created an interactive dashboard in Excel. You can further customize your dashboard to your liking.

Here you can download Interactive Dashboard template.
Further reading:
Assign macro to a button
Interactive Map Dashboard
Bar Chart