In statistics, we’re often interested in understanding how two variables are related to each other. For example, we might want to know:
- What is the relationship between the number of hours a student studies and the exam score they receive?
- What is the relationship between the temperature outside and the number of ice cream cones that a food truck sells?
- What is the relationship between marketing dollars spent and total income earned for a certain business?
In each of these scenarios, we’re trying to understand the relationship between two different variables.
In statistics, one of the most common ways that we quantify a relationship between two variables is by using the Pearson correlation coefficient, which is a measure of the linear association between two variables. It has a value between -1 and 1 where:
- -1 indicates a perfectly negative linear correlation between two variables
- 0 indicates no linear correlation between two variables
- 1 indicates a perfectly positive linear correlation between two variables
Often denoted as r, this number helps us understand how strong a relationship is between two variables. The further away r is from zero, the stronger the relationship between the two variables.
It’s important to note that two variables could have a strong positive correlation or a strong negative correlation.
Strong positive correlation: When the value of one variable increases, the value of the other variable increases in a similar fashion. For example, the more hours that a student studies, the higher their exam score tends to be. Hours studied and exam scores have a strong positive correlation.
Strong negative correlation: When the value of one variable increases, the value of the other variable tends to decrease. For example, the older a chicken becomes, the less eggs they tend to produce. Chicken age and egg production have a strong negative correlation.
The following table shows the rule of thumb for interpreting the strength of the relationship between two variables based on the value of r:
| Absolute value of r | Strength of relationship |
|---|---|
| r | No relationship |
| 0.25 | Weak relationship |
| 0.5 | Moderate relationship |
| r > 0.75 | Strong relationship |
The correlation between two variables is considered to be strong if the absolute value of r is greater than 0.75. However, the definition of a “strong” correlation can vary from one field to the next.
Medical
For example, often in medical fields the definition of a “strong” relationship is often much lower. If the relationship between taking a certain drug and the reduction in heart attacks is r = 0.3, this might be considered a “weak positive” relationship in other fields, but in medicine it’s significant enough that it would be worth taking the drug to reduce the chances of having a heart attack.
Human Resources
In another field such as human resources, lower correlations might also be used more often. For example, the correlation between college grades and job performance has been shown to be about r = 0.16. This is fairly low, but it’s large enough that it’s something a company would at least look at during an interview process.
Technology
And in a field like technology, the correlation between variables might need to be much higher in some cases to be considered “strong.” For example, if a company creates a self-driving car and the correlation between the car’s turning decisions and the probability of getting in a wreck is r = 0.95, this is likely too low for the car to be considered safe since the result of making the wrong decision can be fatal.
Visualizing Correlations
No matter which field you’re in, it’s useful to create a scatterplot of the two variables you’re studying so that you can at least visually examine the relationship between them.
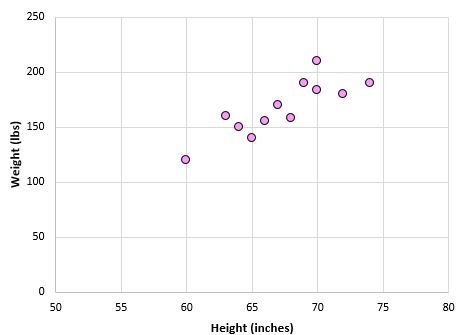
For example, suppose we have the following dataset that shows the height an weight of 12 individuals:

It’s a bit hard to understand the relationship between these two variables by just looking at the raw data. However, it’s much easier to understand the relationship if we create a scatterplot with height on the x-axis and weight on the y-axis:

Clearly there is a positive relationship between the two variables.
Creating a scatterplot is a good idea for two more reasons:
(1) A scatterplot allows you to identify outliers that are impacting the correlation.
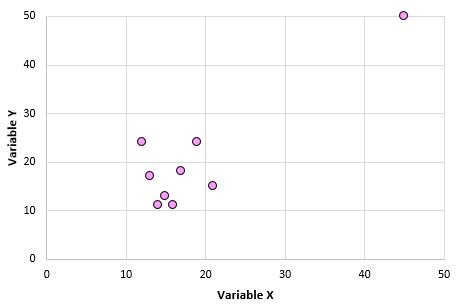
One extreme outlier can dramatically change a Pearson correlation coefficient. Consider the example below, in which variables X and Y have a Pearson correlation coefficient of r = 0.00.

But now imagine that we have one outlier in the dataset:

This outlier causes the correlation to be r = 0.878. This single data point completely changes the correlation and makes it seem as if there is a strong relationship between variables X and Y, when there really isn’t.
(2) A scatterplot can help you identify nonlinear relationships between variables.
A Pearson correlation coefficient merely tells us if two variables are linearly related. But even if a Pearson correlation coefficient tells us that two variables are uncorrelated, they could still have some type of nonlinear relationship. This is another reason that it’s helpful to create a scatterplot.
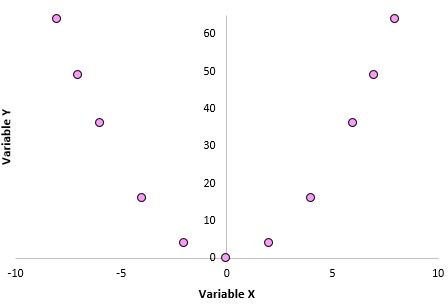
For example, consider the scatterplot below between variables X and Y, in which their correlation is r = 0.00.

The variables clearly have no linear relationship, but they do have a nonlinear relationship: The y values are simply the x values squared. A correlation coefficient by itself couldn’t pick up on this relationship, but a scatterplot could.
Conclusion
In summary:
- As a rule of thumb, a correlation greater than 0.75 is considered to be a “strong” correlation between two variables.
- However, this rule of thumb can vary from field to field. For example, a much lower correlation could be considered strong in a medical field compared to a technology field. It’s best to use domain specific expertise when deciding what is considered to be strong.
- When using a correlation to describe the relationship between two variables, it’s useful to also create a scatterplot so that you can identify any outliers in the dataset along with a potential nonlinear relationship.
Additional Resources
What is Considered to Be a “Weak” Correlation?
Correlation Matrix Calculator
How to Read a Correlation Matrix
