To “detrend” time series data means to remove an underlying trend in the data. The main reason we would want to do this is to more easily see subtrends in the data that are seasonal or cyclical.
For example, consider the following time series data that represents the total sales for some company during 20 consecutive periods:

Clearly the sales is trending upwards over time, but there also appears to be a cyclical or seasonal trend in the data, which can be seen by the tiny “hills” that occur over time.
To gain a better view of this cyclical trend, we can detrend the data. In this case, this would involve removing the overall upward trend over time so that the resulting data represents just the cyclical trend.

There are two common methods used to detrend time series data:
1. Detrend by Differencing
2. Detrend by Model Fitting
This tutorial provides a brief explanation of each method.
Method 1: Detrend by Differencing
One way to detrend time series data is to simply create a new dataset where each observation is the difference between itself and the previous observation.
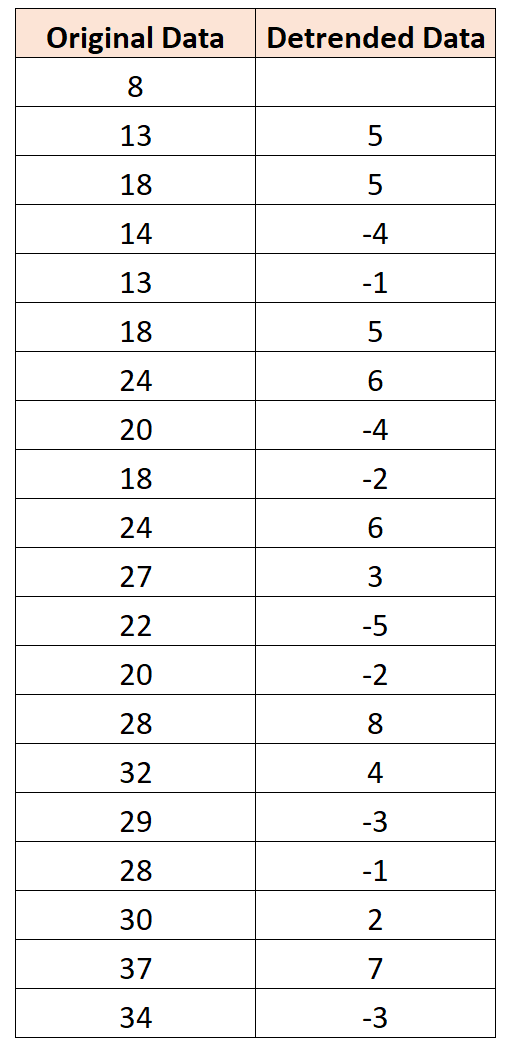
For example, the following image shows how to use differencing to detrend a data series.
To obtain the first value of the detrended time series data, we calculate 13 – 8 = 5. Then to obtain the next value we calculate 18-13 = 5, and so on.

The following plot shows the original time series data:

And this plot shows the detrended data:

Notice how it’s much easier to see the seasonal trend in the time series data in this plot because the overall upward trend has been removed.
Method 2: Detrend by Model Fitting
Another way to detrend time series data is to fit a regression model to the data and then calculate the difference between the observed values and the predicted values from the model.
For example, suppose we have the same dataset:

If we fit a simple linear regression model to the data, we can obtain a predicted value for each observation in the dataset.
We can then find the difference between the actual value and the predicted value for each observation. These differences represent the detrended data.

If we create a plot of the detrended data, we can visualize the seasonal or cyclical trend in the data much more easily:

Note that we used linear regression in this example, but it’s possible to use a more complex method like exponential regression if there is more of an exponentially increasing or decreasing trend in the data.
